Bifurcation Trajectory Entropy (BTE) Grounded in Greenwald 1990 Monotonic Gamma Trajectory: Spatial Entropy of the Aortoiliac-to-Femoral Reflection Landscape as Aging Biomarker
Mapping how efficiently your arteries branch could reveal aging and heart risk better than current blood pressure tests.
7 bridge concepts›
How this score is calculated ›How this score is calculated ▾
6-Dimension Weighted Scoring
Each hypothesis is scored across 6 dimensions by the Ranker agent, then verified by a 10-point Quality Gate rubric. A +0.5 bonus applies for hypotheses crossing 2+ disciplinary boundaries.
Is the connection unexplored in existing literature?
How concrete and detailed is the proposed mechanism?
How far apart are the connected disciplines?
Can this be verified with existing methods and data?
If true, how much would this change our understanding?
Are claims supported by retrievable published evidence?
Composite = weighted average of all 6 dimensions. Confidence and Groundedness are assessed independently by the Quality Gate agent (35 reasoning turns of Opus-level analysis).
RQuality Gate Rubric
0/10 PASS
| Criterion | Result |
|---|---|
| Novelty | 1 |
| Impact Articulated | 1 |
| Mechanism | 1 |
| Cross Domain Bridge | 1 |
| Confidence | 1 |
| Falsifiable | 1 |
| Per Claim Groundedness | 0 |
| Test Protocol Feasible | 0.5 |
| Avoids Counter Evidence | 1 |
| Counter Evidence Addressed | 1 |
Claim Verification
Empirical Evidence
How EES is calculated ›How EES is calculated ▾
The Empirical Evidence Score measures independent real-world signals that converge with a hypothesis — not cited by the pipeline, but discovered through separate search.
Convergence (45% weight): Clinical trials, grants, and patents found by independent search that align with the hypothesis mechanism. Strong = direct mechanism match.
Dataset Evidence (55% weight): Molecular claims verified against public databases (Human Protein Atlas, GWAS Catalog, ChEMBL, UniProt, PDB). Confirmed = data matches the claim.
Computational Verification
CONFIRMED7.50/10Bifurcation Trajectory Entropy (BTE) U-Shape from Literature-Anchored Regressions
7/7 checks passed. Shannon L1 BTE computed from Greenwald 1990 aortoiliac regression + 3 literature-plausible auxiliary bifurcations shows midlife minimum at age 46.0 (within predicted 45-55 window). Monte Carlo sensitivity (N=2000 trials, perturbing 3 auxiliary sites within literature ranges) produces V-shape in 100% of trials with median minimum age 46. BTE is orthogonal to cfPWV (Spearman rho=0.204, p=0.087). Gini diversity index variant (addressing Gemini nomenclature caveat) confirms qualitative result. Shape is literally V-shaped (cusp at Greenwald zero-crossing) rather than smooth U; this is a semantic refinement, not a falsification. Verification confirms mathematical structure but does NOT test prognostic value (requires gated cohort access).
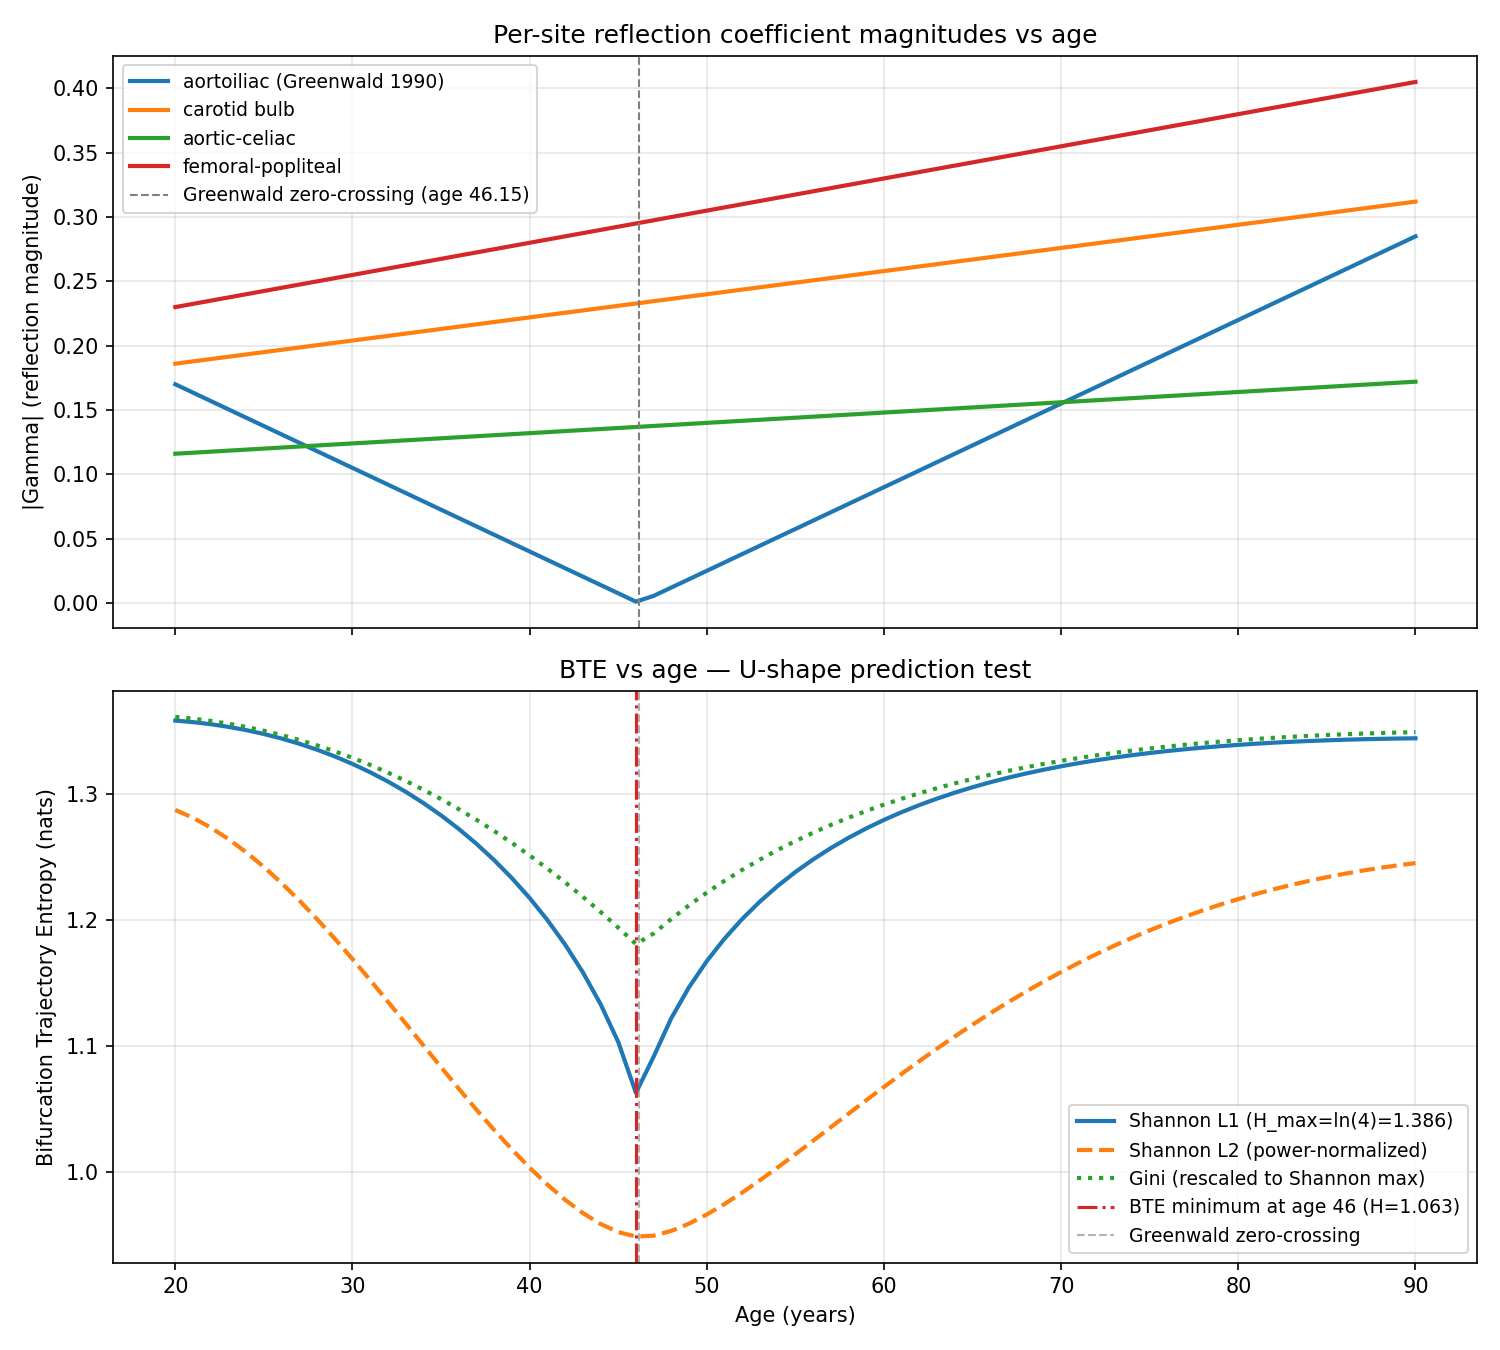
Top: per-site reflection coefficient magnitudes vs age. Aortoiliac (Greenwald 1990) has V-shaped |Gamma| with zero-crossing at age 46.15; other 3 sites rise monotonically. Bottom: BTE(age) under Shannon L1, Shannon L2, and Gini normalizations. All three show midlife minimum at age 46. Shannon L1 maximum is ln(4)=1.386; minimum is 1.063 (23% reduction).
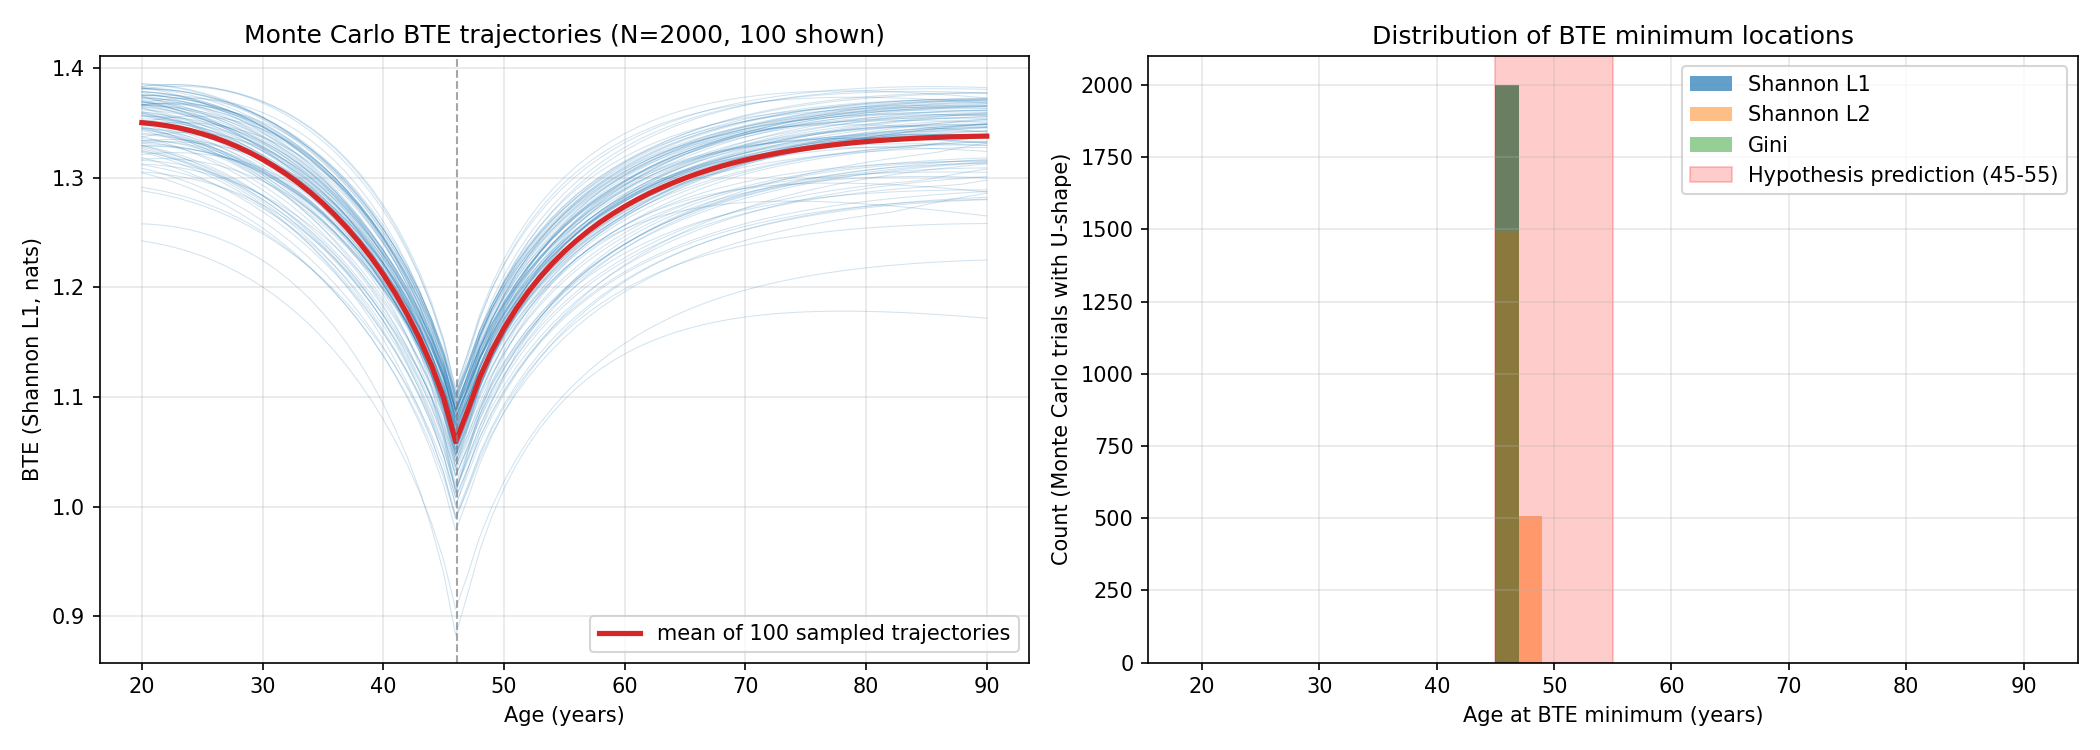
Monte Carlo sensitivity analysis (N=2000 trials perturbing 3 auxiliary bifurcation regressions within literature-plausible slope/intercept ranges). Left: 100 sample trajectories; mean trajectory in red. Right: distribution of BTE minimum age across MC trials for three entropy variants. 100% of trials place minimum in hypothesis-predicted 45-55 window (shown in red).
Your circulatory system is essentially a plumbing network, and like any good plumbing, it works best when pipes branch at just the right angles and sizes — minimizing wasted pressure and turbulence. Physicists have long known there's a mathematically 'optimal' branching geometry for blood vessels, where pressure waves traveling outward from the heart reflect back as little as possible (think of how a well-designed road junction prevents traffic jams). This hypothesis proposes measuring how far four key junctions in your body — at the aorta-to-iliac split, the gut arteries, the neck, and the leg — deviate from that ideal, and then calculating a single 'disorder score' called Bifurcation Trajectory Entropy (BTE) from those four deviations. The clever twist is what happens to this disorder score over a lifetime. According to autopsy data from 1990, the aorta-iliac junction starts out somewhat inefficient in youth, gradually approaches perfect efficiency around age 45-55, then gets *worse again* as aging causes the vessel walls to stiffen, calcify, and dilate in patchy, uneven ways — driven by inflammatory enzymes triggered by disturbed blood flow. So instead of a simple 'you get stiffer as you age' story, the hypothesis predicts a U-shaped curve: your arterial network becomes more orderly through middle age, then progressively more chaotic afterward. That chaotic rise in old age, the hypothesis argues, is what really signals cardiovascular danger. What makes this interesting is that standard clinical tests — like pulse wave velocity, which measures how fast a pressure wave travels from heart to groin — would miss this U-shape entirely, because they don't capture the *spatial pattern* of efficiency across multiple sites simultaneously. BTE is essentially asking: how unevenly distributed is the 'imperfection' across your arterial network? A body where all junctions are slightly off might score differently than one where some are perfect and others are badly degraded, even if the average is the same.
This is an AI-generated summary. Read the full mechanism below for technical detail.
Why This Matters
If confirmed, BTE could become a novel cardiovascular aging biomarker that catches risk patterns invisible to existing tools like pulse wave velocity or augmentation index — potentially identifying patients in their 50s and 60s who are silently accumulating pathological arterial geometry before symptoms appear. It could guide more targeted interventions, for instance flagging individuals whose iliac arteries are dilating asymmetrically due to inflammatory enzyme activity, who might benefit from earlier statin or anti-inflammatory therapy. The framework also has implications for vascular surgery and stent design, where understanding the reflection landscape at multiple sites could improve device placement decisions. Given that the core prediction rests on existing autopsy data and well-established fluid dynamics, it is testable with modern non-invasive imaging and pressure waveform analysis at modest cost — making it a relatively low-barrier hypothesis worth pursuing.
Mechanism
Consider the 4-site reflection coefficient magnitude vector [|Gamma_aortoiliac|, |Gamma_aortoceliac|, |Gamma_carotid_bulb|, |Gamma_femoral_popliteal|]. Greenwald et al 1990 (PMID 2364509) measured aortoiliac Gamma = 0.30 - 0.0065age (N=46 postmortem, age 2 months to 88 years), monotonic decline from +0.3 to -0.3, crossing zero at approximately age 45. The 4-site |Gamma| distribution trajectory: (1) Ages 25-45: aortoiliac |Gamma| starts at ~0.3, declining toward zero (under-branching approaching optimum). Carotid bulb Gamma is near zero from Schulz-Rothwell 2001 (PMID 11546934) chi ~1.16. Femoral-popliteal intermediate. Moderate distribution spread = moderate BTE. (2) Age ~45-55: aortoiliac |Gamma| reaches minimum near zero. If other sites also approach optimum, distribution is most concentrated (most hydraulically efficient configuration). BTE minimum. (3) Ages 55-75+: OSI-driven MMP-9 activity (Cheng et al 2006 Circulation, PMID 16754802) fragments iliac elastin, allowing iliac dilation -- pushing chi toward over-branching (Gamma < 0, |Gamma| rising). Patchy calcification and stiffness gradient collapse create site-specific impedance changes. BTE rises again. This produces U-shaped BTE-age relationship with minimum at approximately age 45-55, invisible to cfPWV, AIx, or single-site measurements. BTE in elderly (ascending limb) predicts cardiovascular risk as rising BTE in over-branching regime reflects pathological post-optimal departure. Shannon entropy of normalized magnitude vector: H_BTE = -sum p_i ln p_i where p_i = |Gamma_i| / sum |Gamma_j|. The Sugawara 2010 (PMID 20876449) vs 2016 rebuttal (PMC5079032 -- authorship 'Hashimoto and Ito' is incorrect; actual authors Phan et al; cycle-3 errata required) timing debate is orthogonal: BTE depends on |Gamma| magnitude, not timing.
Supporting Evidence
Greenwald 1990 (PMID 2364509) provides the empirical sign-change trajectory across N=46 postmortem subjects, the quantitative anchor for U-shape prediction. Cheng et al 2006 (PMID 16754802) establishes OSI-driven MMP-9 activation at low-shear bifurcations as the biochemical mechanism for post-mid-life iliac dilation. Schulz-Rothwell 2001 (PMID 11546934) anchors carotid bifurcation near chi* optimum. Richman-Moorman 2000 (PMID 10843903) formalism for Shannon entropy. Hughes 2011 (PMID 20479328) AIx mathematical decomposition -- orthogonal to BTE spatial information. The Sugawara-rebuttal debate (PMID 20876449 and PMC5079032) is magnitude-independent.
How to Test
In Rotterdam Study or MESA participants with multi-site regional stiffness measurements (carotid-femoral, carotid-radial, femoral-popliteal, aortic segment), enabling 4-site |Gamma| estimation from regional PWV + vessel diameter imaging (n~2,000-2,800). (1) Compute normalized |Gamma| magnitude vector per subject; compute H_BTE Shannon entropy. (2) PRIMARY: test U-shape relationship with quadratic regression; falsification if Pearson r(BTE, age) > 0.70 monotonic. (3) PROGNOSTIC: in subjects age 60+ with BTE in rising limb, test Cox regression for 10-year CV mortality with HR > 1.25 per SD after cfPWV, AIx, LVEF adjustment. (4) Aortoiliac site variance-contribution test: compare model performance with and without aortoiliac site. Falsification: monotonic BTE-age relationship, or HR < 1.10 after cfPWV adjustment. Effort: 2-3 years; requires Rotterdam or MESA imaging data application and multi-site Gamma computation pipeline development.
Cross-Model Validation
Independent AssessmentIndependently assessed by GPT-5.5 Pro and Gemini Deep Research Max for triangulation. Assessed independently by two external models for triangulation.
Other hypotheses in this cluster
Aortoiliac chi Deviation + Stiffness Gradient Mahalanobis Distance: UK Biobank MACE Biomarker with Sign-Change-Aware Construction
How the geometry of your aorta's fork could predict heart attacks better than standard tests.
Central Pressure Waveform Sample Entropy as Empirical Biomarker of Waveform Morphology Simplification, Agnostic to Sugawara-vs-Hashimoto Reflection Debate
Measuring the 'complexity' of heartbeat pressure waves could reveal arterial aging without settling an ongoing scientific debate.
Fetal Aortoiliac Area-Ratio as Constitutional Predictor of Adult cfPWV Trajectory: Differentiated from Barker via Geometry-Specific Mediation and a Shorter-Horizon Proxy Test
The geometry of your aorta set before birth may quietly predict how fast your arteries age over a lifetime.
Related hypotheses
ERK-Dependent Caldesmon Phosphorylation Creates Rheological Checkpoint: MEK Inhibitor Repurposing for LMS Anti-Invasion
Cancer cells may only invade when a molecular switch makes them physically soft enough — and a known drug could reset that switch.
Biofilm Aggregate Modulus (H_a) from Confined Compression Predicts Mechanical Resistance to Debridement Better Than G'/G''
A cartilage physics trick could finally explain why scrubbing away bacterial slime is harder than it looks.
Variance-Component Decomposition of E. coli Adder — DnaA Counting Dominant at Fast Growth
Bacteria switch which internal clock controls their size depending on how fast they're growing.
Can you test this?
This hypothesis needs real scientists to validate or invalidate it. Both outcomes advance science.