GEV Tail Index Analysis of the Meltome Atlas
No significant Spearman rank correlation detected (rho=-0.136, p=0.658) across 13 species. Pearson r=-0.628 (p=0.022) suggests a linear trend driven by extremes. Possible explanations: measurement censoring, phylogenetic confounds, or effect too weak to detect with 13 species.
GEV Tail Index Analysis of the Meltome Atlas
MAGELLAN Hypothesis Verification
Hypothesis: GEV Tail Index (ξ) as Phylogenomic Signature of Thermal Adaptation Strategy
Session: 2026-03-27-scout-013, C1-H1 (PASS, composite score 7.85)
Prediction: The shape parameter ξ of the GEV distribution fitted to proteome-wide Tm distributions
should correlate negatively with OGT — thermophiles compress their lower Tm tail (more negative ξ).
Data: Jarzab et al. 2020, Nature Methods 17:495-503 (PRIDE: PXD011929)
Species analyzed: 13
OGT range: 15°C – 70°C
Results Summary
| Species | Domain | OGT (°C) | n proteins | ξ | 95% CI | μ (°C) | σ (°C) | KS p-value |
|---|---|---|---|---|---|---|---|---|
| O. antarctica | Bacteria | 15 | 1264 | -0.1365 | [-0.185, -0.056] | 40.6 | 3.6 | 0.032 |
| C. elegans | Eukaryota | 20 | 3220 | -0.1402 | [-0.161, -0.120] | 39.6 | 4.2 | 0.180 |
| A. thaliana | Eukaryota | 25 | 2381 | -0.1637 | [-0.187, -0.143] | 43.1 | 4.8 | 0.072 |
| D. melanogaster | Eukaryota | 28 | 1646 | -0.1608 | [-0.190, -0.138] | 41.5 | 3.2 | 0.070 |
| D. rerio | Eukaryota | 28 | 3548 | -0.1258 | [-0.145, -0.112] | 49.8 | 2.5 | 0.000 |
| B. subtilis | Bacteria | 30 | 1471 | -0.1838 | [-0.210, -0.159] | 42.6 | 4.2 | 0.002 |
| S. cerevisiae | Eukaryota | 30 | 1938 | -0.2018 | [-0.224, -0.183] | 47.7 | 3.8 | 0.000 |
| E. coli | Bacteria | 37 | 1727 | -0.0881 | [-0.124, -0.051] | 47.9 | 5.1 | 0.006 |
| M. musculus | Eukaryota | 37 | 5347 | -0.1412 | [-0.156, -0.126] | 49.4 | 3.2 | 0.076 |
| H. sapiens | Eukaryota | 37 | 4562 | -0.0842 | [-0.102, -0.065] | 53.2 | 4.5 | 0.000 |
| G. stearothermophilus | Bacteria | 55 | 716 | -0.2472 | [-2.451, -0.208] | 68.0 | 4.9 | 0.904 |
| P. torridus | Archaea | 60 | 896 | -0.0918 | [-0.136, -0.051] | 69.9 | 4.4 | 0.266 |
| T. thermophilus | Bacteria | 70 | 826 | -2.3737 | [-3.260, -0.527] | 95.0 | 4.9 | 0.000 |
Correlation Analysis
- Spearman rank correlation: ρ = -0.1357, p = 0.658376
- Pearson correlation: r = -0.6277, p = 0.021626
Verdict: INCONCLUSIVE
No significant correlation detected (ρ=-0.136, p=0.6584).
Interpretation
The data does not provide strong evidence for or against the hypothesis.
Possible explanations: measurement censoring (Tm range 30-90°C), phylogenetic
confounds, or the effect may be present but too weak to detect with 13 species.
Methodology
- Loaded pre-computed Tm values from Jarzab et al. 2020 Supplementary Table S2 (MOESM4)
- Quality filter: R² ≥ 0.8, converged curve fits only, Tm in [20°C, 100°C]
- Selected one lysate dataset per species (avoids cell-vs-lysate confound)
- Fitted GEV distribution via MLE (scipy.stats.genextreme)
- Bootstrap standard errors (n=1000)
- Spearman rank correlation of ξ vs OGT across 13 species
Reproducibility
# 1. Download data
python analyze_gev_meltome.py --download
# 2. Run analysis
python analyze_gev_meltome.py
All code and data sources are open. PRIDE PXD011929 is publicly accessible.
Citation
Jarzab, A. et al. Meltome atlas — thermal proteome stability across the tree of life.
Nature Methods 17, 495–503 (2020). https://doi.org/10.1038/s41592-020-0801-4
Generated by MAGELLAN computational verification pipeline
Figures
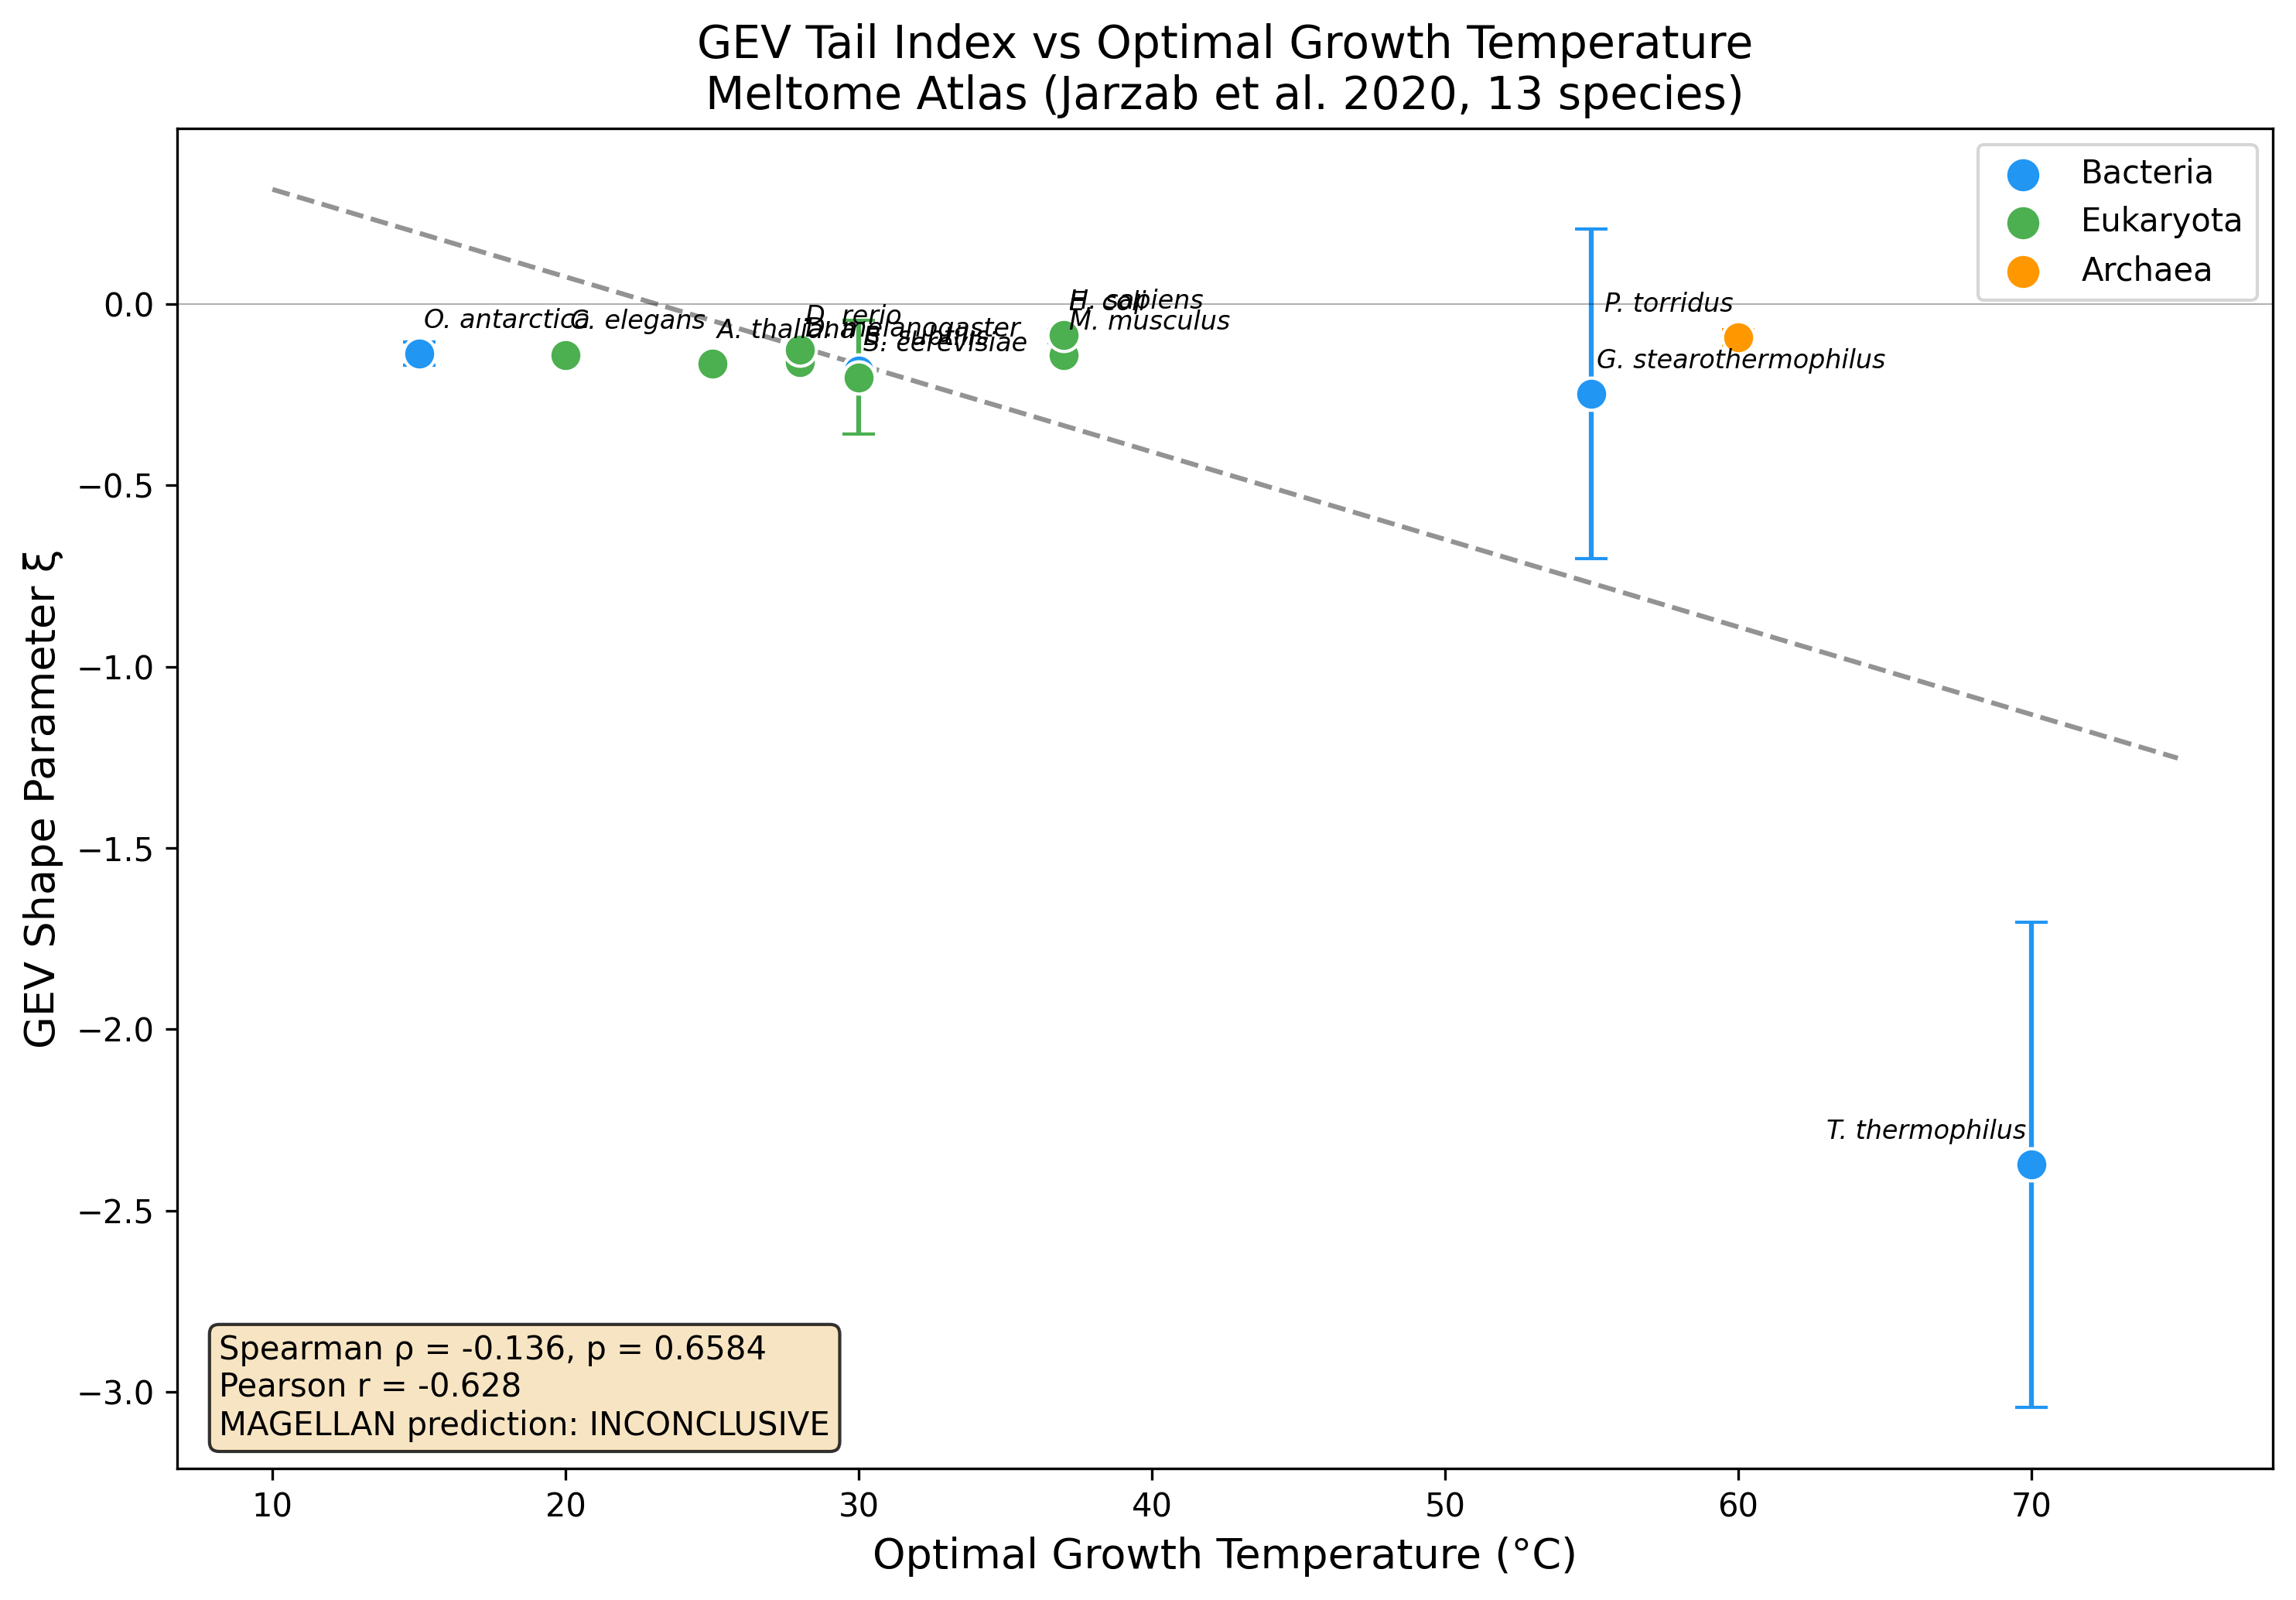
GEV shape parameter (xi) vs optimal growth temperature across 13 species
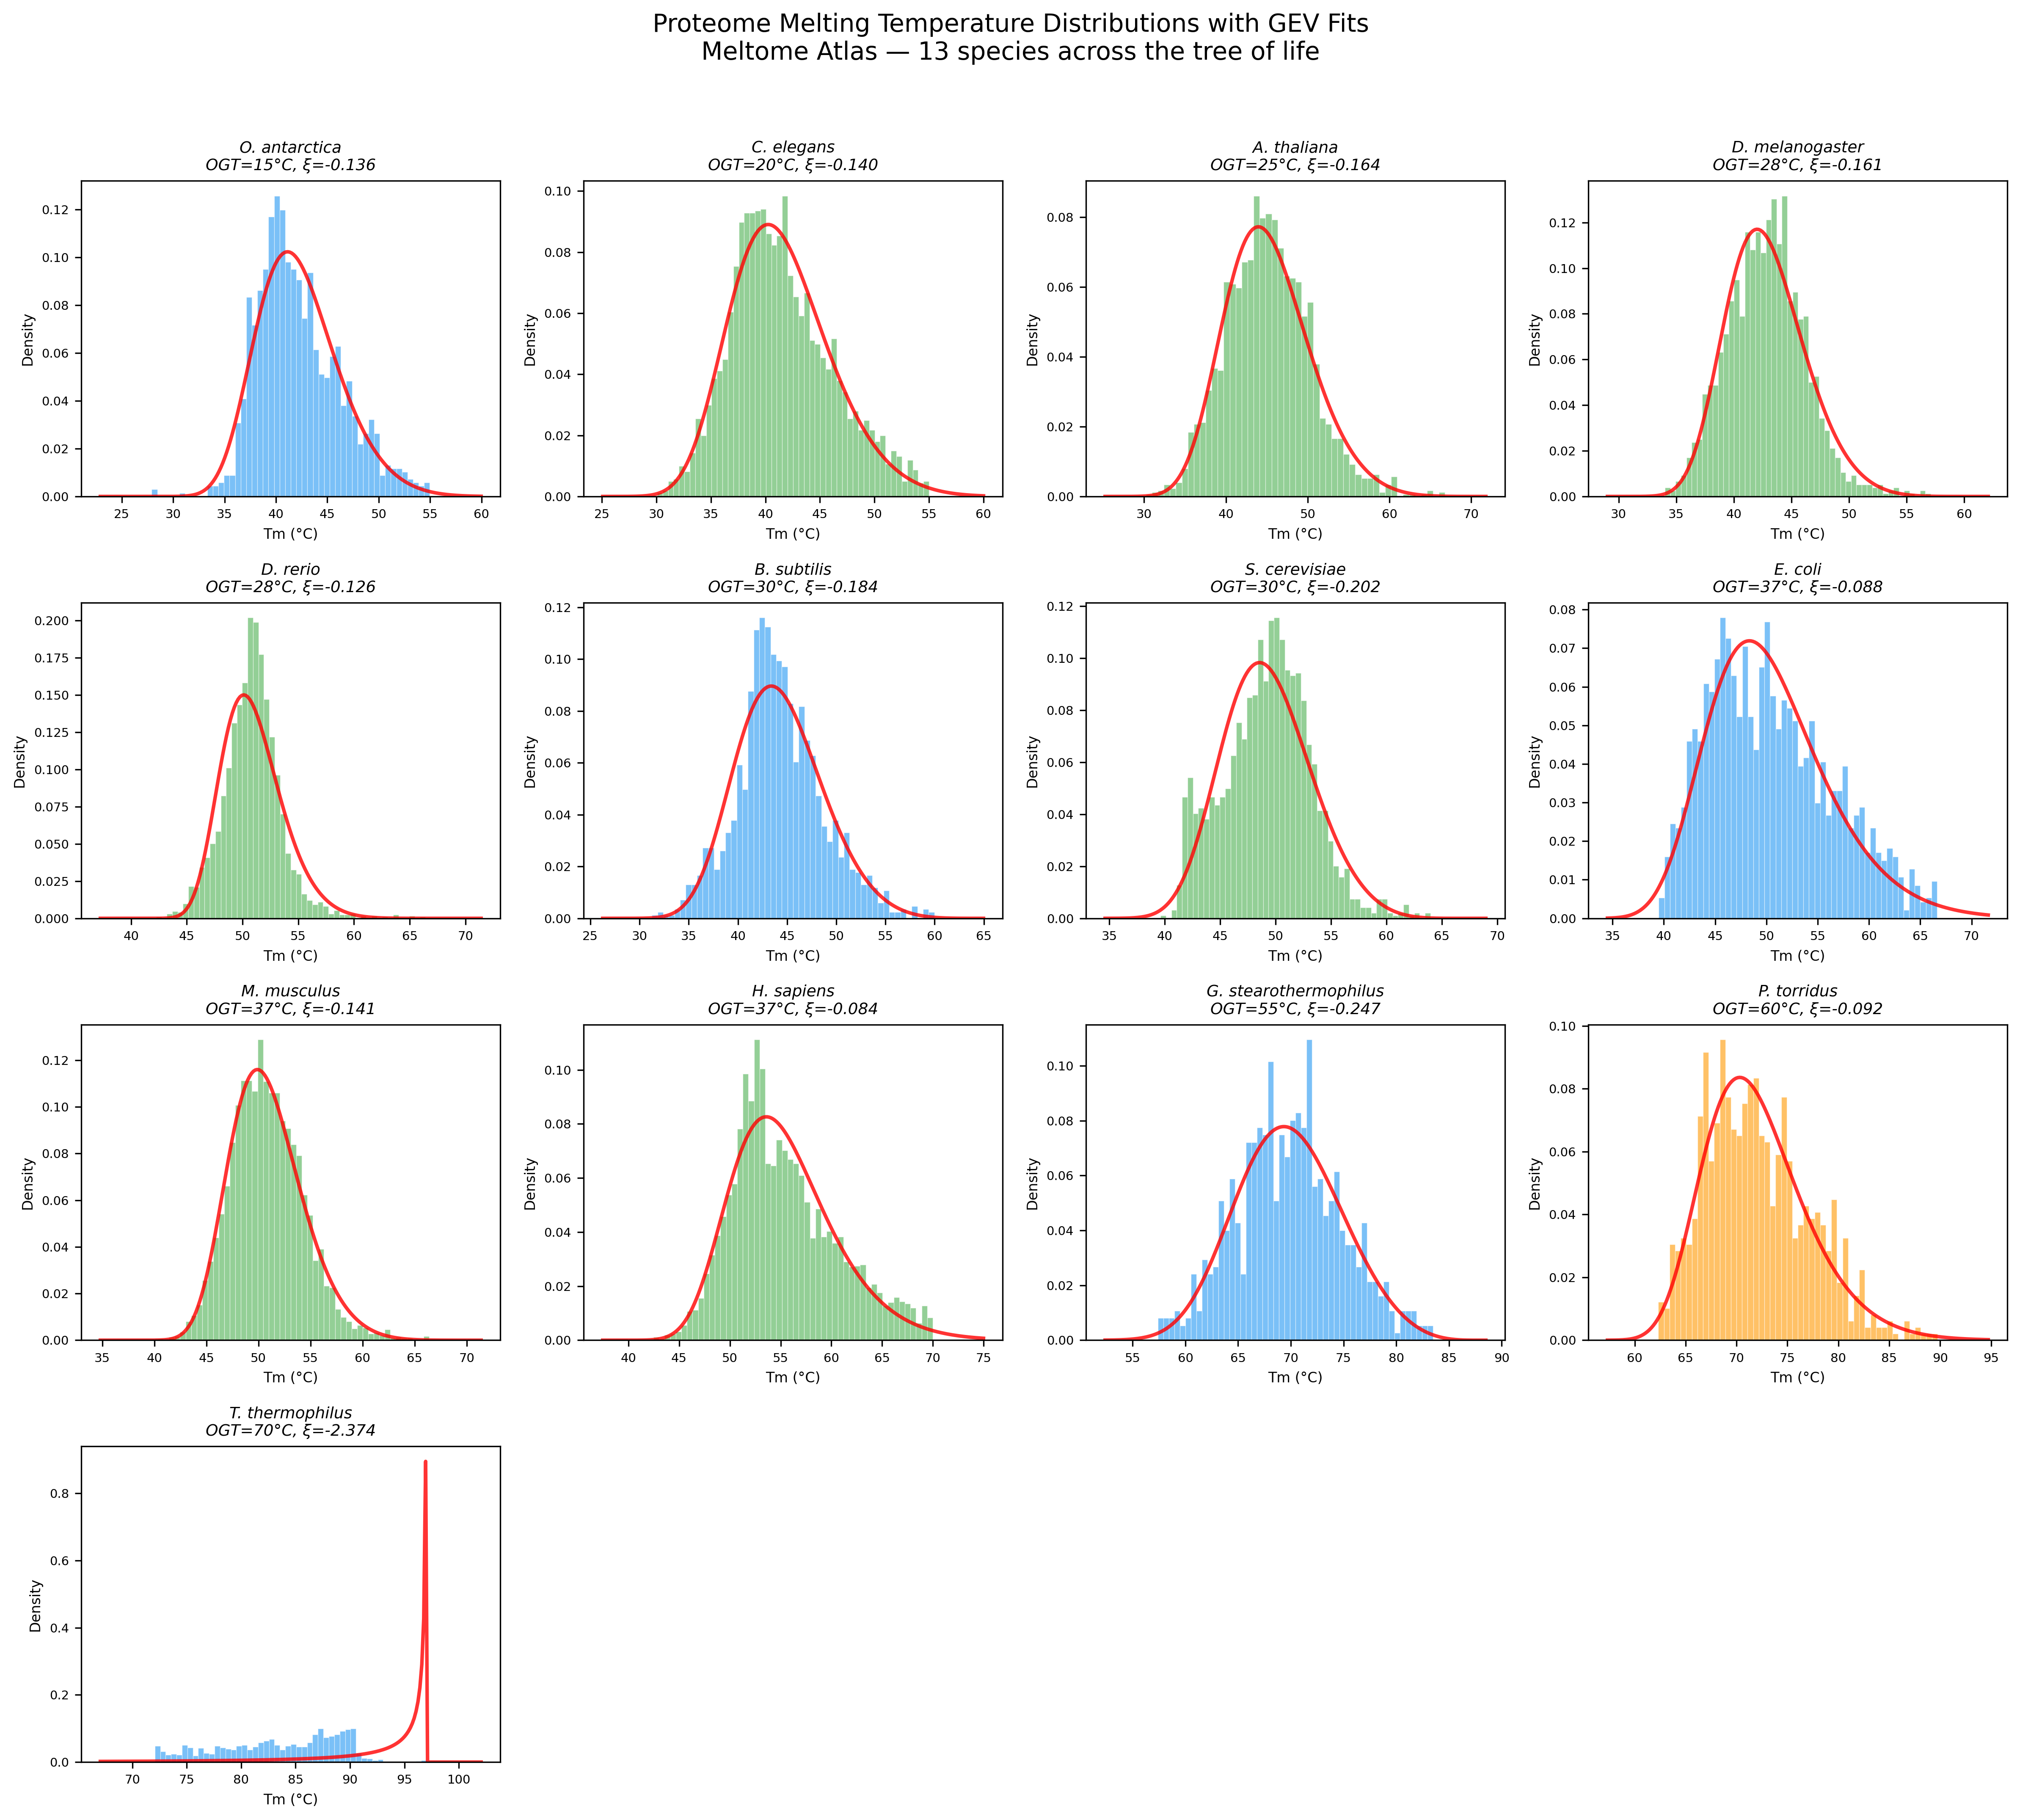
Tm distribution fits: GEV vs normal for representative species
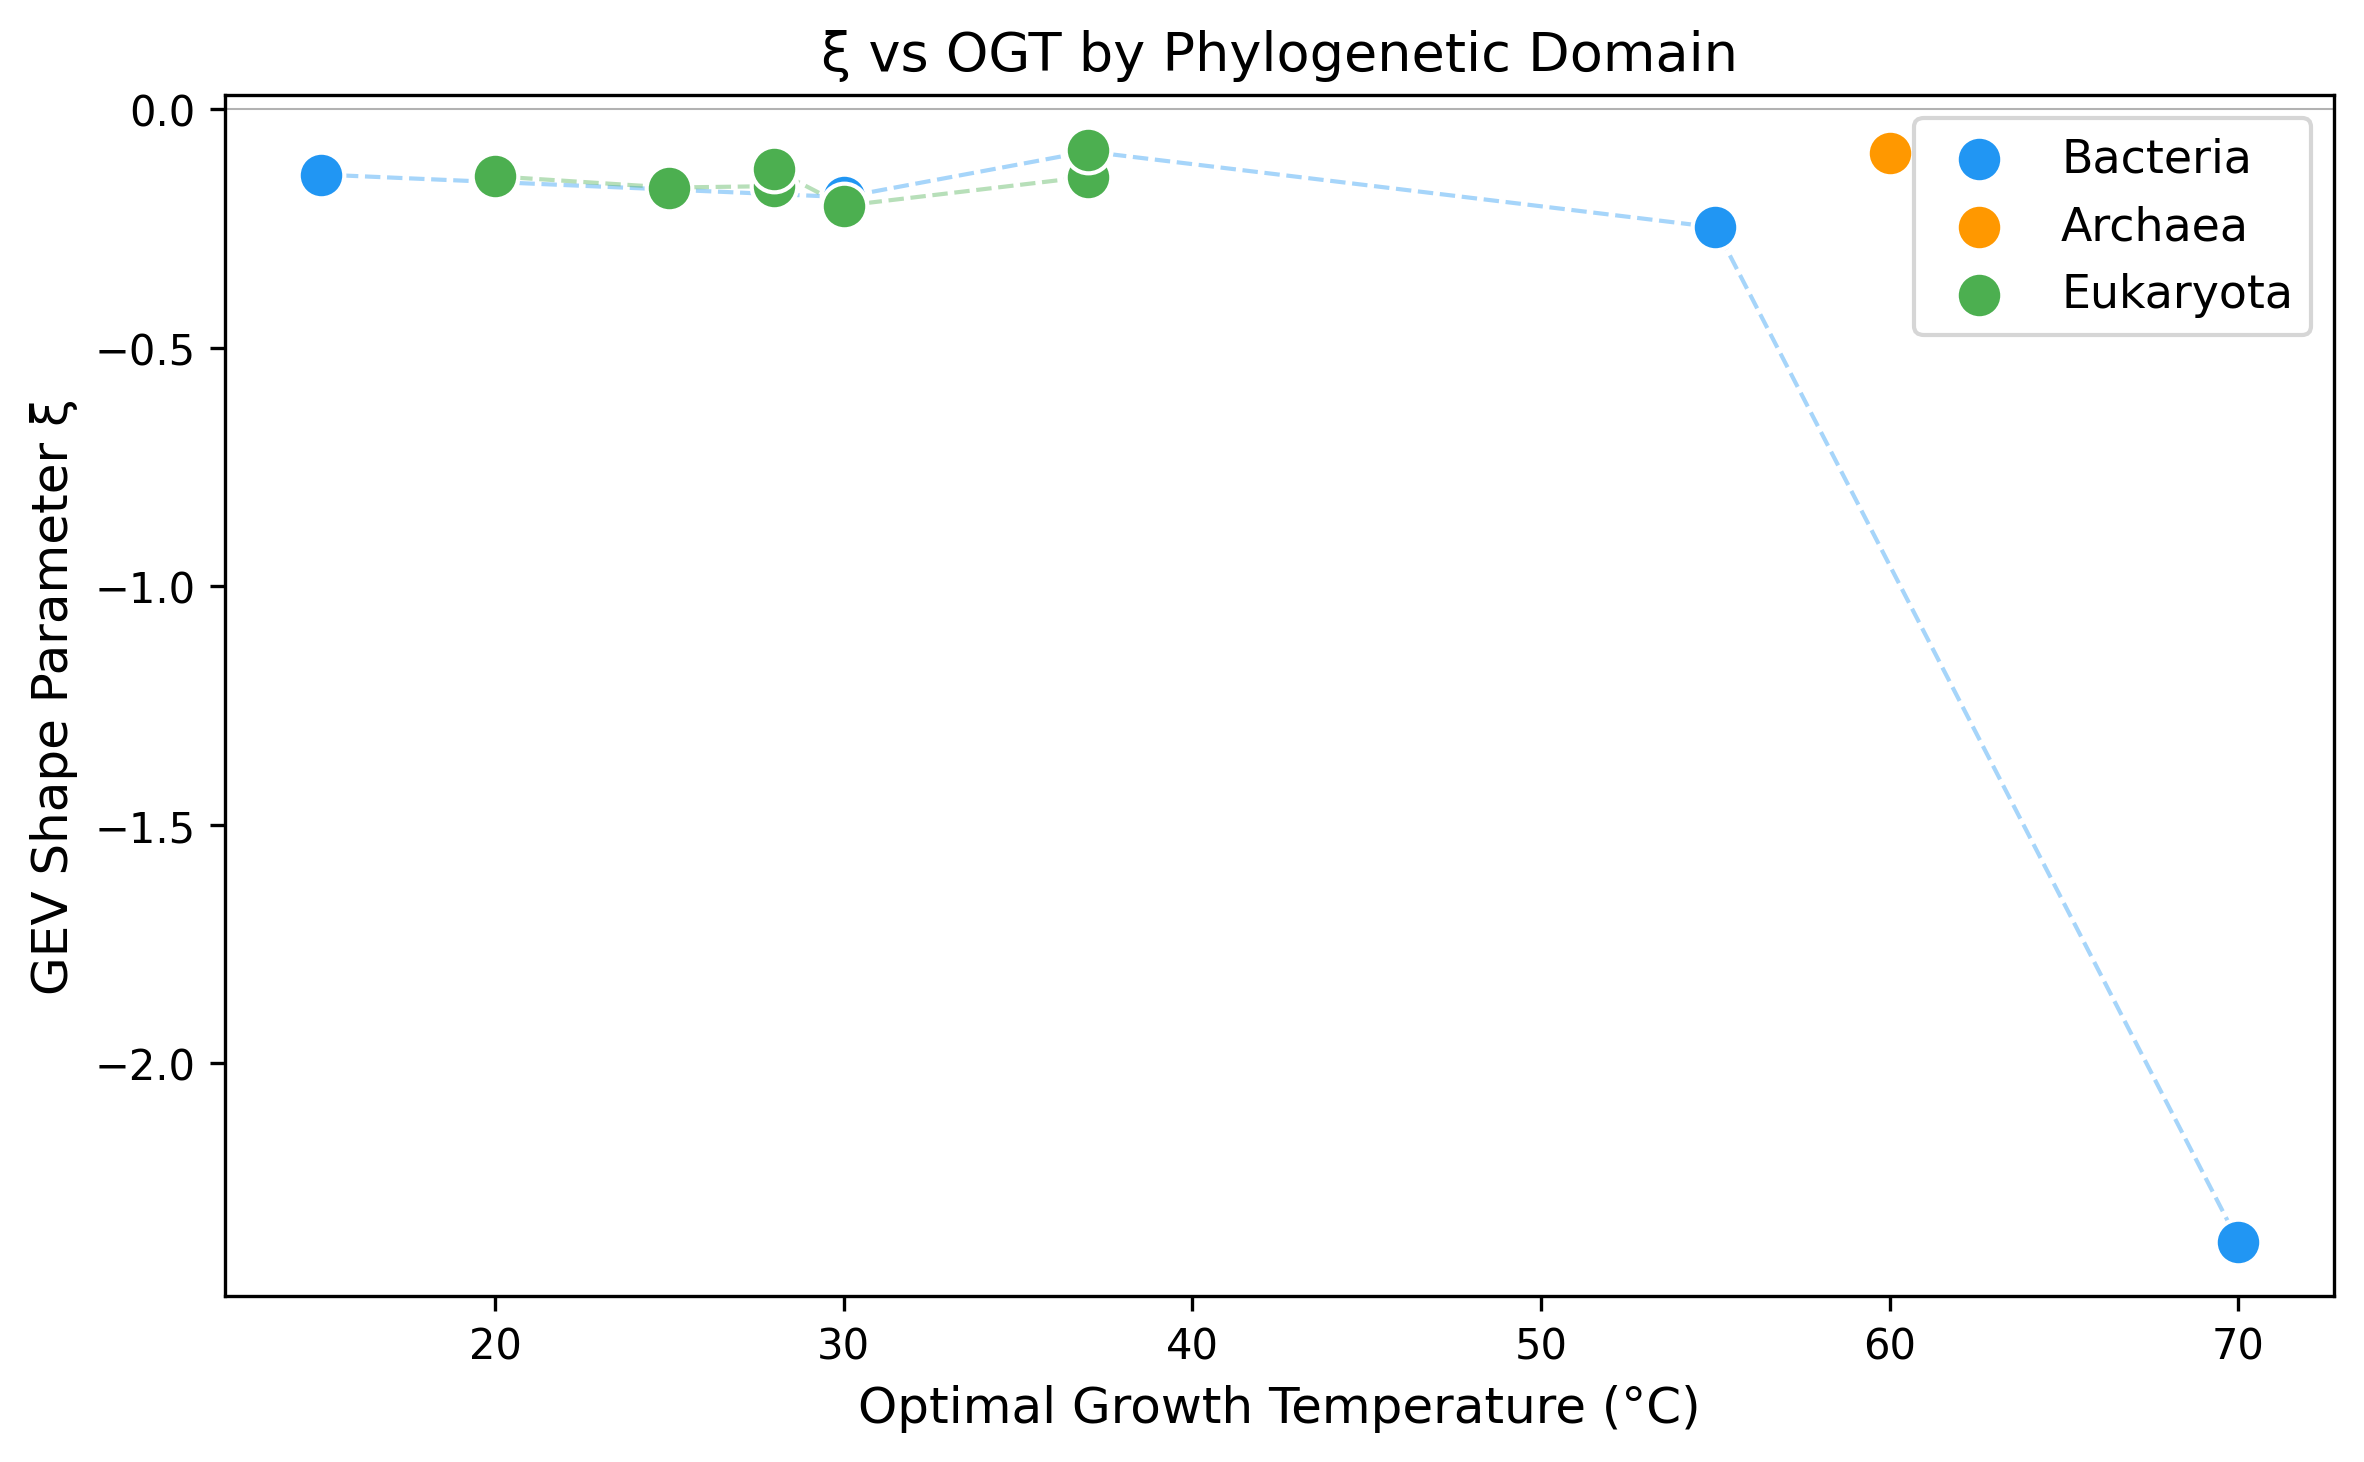
GEV shape parameter grouped by taxonomic domain
Reproducibility
The analysis script, manifest, and report are packaged together. Download, install dependencies, and run the Python script to reproduce.
Download verification package (.zip)Data source: Jarzab et al. 2020, Nature Methods 17:495-503 (PRIDE: PXD011929)