Maxwell Relaxation Time Aging Exponent beta_M in FUS-P525L Condensates
Arithmetic and methodology CONFIRMED: log(10)/log(24) = 0.7245, and log-log fit recovers known exponents (R^2 = 0.996 on synthetic data). Jawerth 2020 Table 1 as cited in Alshareedah 2022 (PMC9326828) gives beta_M = 0.79 for FUS and 0.69 for PGL-3 under a 1h->24h time assignment, consistent with the hypothesis WT range [0.5, 0.8]. However, a published theoretical re-fit of the same Jawerth data (PRX Life 2023) reports mu = 2.1-6.4 for PGL-3 tau_c ~ t_w^mu, much larger than the hypothesis WT range, suggesting either single power-law is inappropriate or observables differ. The core disease-discriminator prediction (beta_M^P525L - beta_M^WT > 0.3) is UNTESTED: no published time-resolved P525L viscosity data exist at the resolution required. The hypothesis is not refuted; it remains a clean, executable experiment.
Maxwell Relaxation Time Aging Exponent beta_M in FUS-P525L Condensates
Verification of MAGELLAN Hypothesis E2-H4 (session 2026-04-19-scout-027)
Verdict: INCONCLUSIVE (arithmetic + methodology confirmed; core empirical
claim NOT directly verifiable from publicly accessible data; primary
disease-discriminator prediction is UNTESTED in the literature)
1. Hypothesis
E2-H4 proposes that condensate viscosity follows a power law in aging time:
eta(t_age) = eta_0 * t_age^beta_Mand that the exponent beta_M discriminates healthy (FUS-WT) from
disease-associated (FUS-P525L) condensates, with:
- FUS-WT: beta_M in [0.5, 0.8]
- FUS-P525L: beta_M in [0.9, 1.5]
- Discriminator: beta_M^P525L - beta_M^WT > 0.3 (primary endpoint)
The hypothesis anchors the WT value to Jawerth 2020 Science 370:1317
(PMID 33303613) with the specific claim: "eta increases approximately 10x
from t_age=1h to t_age=24h, giving beta_M = log(10)/log(24) approximately 0.72".
2. Data Sources
Primary (paywalled, not directly accessible)
- Jawerth et al. 2020 Science 370:1317 "Protein condensates as aging
Maxwell fluids" PMID 33303613. This paper contains the raw eta(t_age) data
the hypothesis cites. Full PDF is paywalled and the supplementary tables are
not mirrored in the open literature.
Secondary (open-access, used for verification)
- Alshareedah et al. 2022 JACS Au, PMC9326828. Table 1 reproduces Jawerth
numerical values: FUS eta_early = 4 Pa.s, eta_late = 50 Pa.s (ratio 12.5x);
PGL-3 at 75 mM KCl, eta_early = 4.4 Pa.s, eta_late = 40 Pa.s (ratio 9.09x).
The time points corresponding to "early" and "late" are NOT explicitly
reported in the accessible text.
- PRX Life 1:013006 (2023) "Theory of Rheology and Aging of Protein
Condensates". Reports aging exponent mu where tau_c ~ t_w^mu, fit to the
Jawerth data: mu = 6.4 at 150 mM KCl and mu = 2.1 at 100 mM KCl for PGL-3.
The authors note that these values exceed what their theoretical model
can explain (would require negative alpha).
- arXiv:2303.18028 identical theoretical re-analysis in preprint form.
- Nat Commun 2025 PMID 40473633 (6xPSD multivalent protein) reports
rheological power-law exponent alpha approximately 0.5, attributed to
weak-bond binding/unbinding.
- Nat Phys 2024 PMID 39464253 (hnRNPA1 LCD variants) reports
sequence-specific aging rates but no single exponent.
- Patel et al. 2015 Cell, PMID 26317470. Original study establishing
FUS-P525L as an ALS-linked mutant with accelerated liquid-to-solid
transition in condensates. Contains 24h/48h/72h viscosity and elasticity
measurements but does NOT report a power-law aging exponent.
3. Methodology
3.1. Arithmetic check (Part 1)
Direct computation:
log(10) / log(24) = 0.724527The hypothesis's stated value of approximately 0.72 is correct (to two
decimal places: 0.7245 rounds to 0.72).
3.2. Power-law fit (Part 2)
A log-log linear fit, log(eta) = log(eta_0) + beta_M * log(t_age), was
applied to synthetic data with known beta_M = 0.72 and 5% Gaussian noise.
Recovered beta_M = 0.7087 +/- 0.0207 (95% CI:
[0.6682, 0.7493]),
R^2 = 0.9955. The methodology recovers the true exponent
within statistical error.
3.3. Jawerth 2020 Table 1 reanalysis (Part 3)
Because the exact time points in Jawerth 2020 Table 1 are not accessible in
secondary literature, we computed beta_M under several plausible time
assignments using the published (eta_early, eta_late) values:
protein scenario t_early_h t_late_h eta_early eta_late beta_M
FUS 1h -> 24h 1.0 24.0 4.0 50.0 0.794741
FUS 0.5h -> 24h 0.5 24.0 4.0 50.0 0.652441
FUS 1h -> 10h 1.0 10.0 4.0 50.0 1.096910
FUS 1h -> 48h 1.0 48.0 4.0 50.0 0.652441
PGL-3 1h -> 24h 1.0 24.0 4.4 40.0 0.694537
PGL-3 0.5h -> 24h 0.5 24.0 4.4 40.0 0.570178
PGL-3 1h -> 10h 1.0 10.0 4.4 40.0 0.958607
PGL-3 1h -> 48h 1.0 48.0 4.4 40.0 0.570178
3.4. Monte Carlo uncertainty propagation (Part 5)
With a 10% relative uncertainty on each of eta(1h) and eta(24h) (a typical
microrheology noise floor), the 95% CI on beta_M is:
[0.637, 0.814] (width
0.177, median
0.725). This implies a single two-point measurement cannot
resolve a beta_M difference of 0.3 between WT and P525L without substantial
replication; the hypothesis's specified n>=5 per genotype is appropriate.
3.5. P525L discriminator analysis (Part 6)
If WT beta_M = 0.72 and the discriminative threshold is beta_M^P525L -
beta_M^WT > 0.3, then P525L beta_M >= 1.0200. This implies
the P525L viscosity at 24h is at least 25.6x the 1h
value, i.e., SUPER-LINEAR aging. This is a well-defined, testable prediction
but the required P525L time-resolved viscosity data have NOT been published
at the time of this verification.
4. Results
Core arithmetic CONFIRMED
The formula beta_M = log(eta_ratio) / log(t_ratio) is correct, and the
specific numerical claim log(10)/log(24) = 0.7245 approximately 0.72
is arithmetically correct.
Methodology CONFIRMED
The log-log fitting procedure recovers a known exponent from noisy data
within statistical error.
Jawerth Table 1 magnitude PARTIALLY CONSISTENT
Under the 1h -> 24h time assumption:
- FUS (4 -> 50 Pa.s, 12.5x): beta_M = 0.795
- PGL-3 (4.4 -> 40 Pa.s, 9.09x): beta_M = 0.695
Both values are consistent with the hypothesis's WT range [0.5, 0.8], IF
and only if the early/late Jawerth measurements correspond to 1h and 24h.
The hypothesis does not prove this time assignment.
Published reanalysis INCONSISTENT with hypothesis
An independent theoretical fit to the same Jawerth data (PRX Life 2023)
reports mu = 2.1 to 6.4 for PGL-3 (tau_c ~ t_w^mu). Under the hypothesis's
constant-G' Maxwell assumption, mu is equivalent to beta_M. These values
are MUCH LARGER than the hypothesis's WT range [0.5, 0.8] and would
imply P525L must have beta_M > mu + 0.3 > 2.4, far beyond physical
power-law aging.
The authors of that reanalysis note their theoretical model cannot
accommodate mu > 1 without unphysical parameters, suggesting that either
(a) the Jawerth aging is NOT a single power law (might be stretched
exponential or crossover behaviour) or (b) the relevant exponent depends
on which observable (viscosity vs relaxation time) is fit.
FUS-P525L differential UNTESTED
No published study reports time-resolved viscosity aging of FUS-P525L at
the resolution required (multiple time points, 1h-24h) to extract beta_M.
Patel 2015 measures viscosity at 24, 48, 72h but uses different protocols
(micropipette aspiration) and does not compute an aging exponent.
5. Convergent Evidence Table
id study system exponent_name value ci_low ci_high compares_to_beta_M note
hyp Hypothesis E2-H4 (MAGELLAN) FUS-WT, 1h->24h, 10x eta beta_M 0.72 None None True log(10)/log(24) assumed magnitude
jawerth_fus Jawerth 2020 FUS Table 1 (as cited, 1h->24h) FUS, early->late beta_M 0.79 None None True ln(50/4)/ln(24) under 1h->24h assumption
jawerth_pgl Jawerth 2020 PGL-3 Table 1 (as cited, 1h->24h) PGL-3 75 mM KCl beta_M 0.69 None None True ln(40/4.4)/ln(24) under 1h->24h assumption
prxlife_150 PRX Life 1:013006 theoretical re-fit PGL-3, 150 mM KCl mu (tau_c~tw^mu) 6.40 None None True Relaxation-time aging, equivalent to beta_M when G' constant
prxlife_100 PRX Life 1:013006 theoretical re-fit PGL-3, 100 mM KCl mu (tau_c~tw^mu) 2.10 None None True Weaker aging at lower salt
natcomm2025 Nat Commun 2025 PMID 40473633 6xPSD multivalent network alpha (G(t) power law) 0.50 None None False Weak-bond binding dynamics - DIFFERENT quantity
natphys24 Nat Phys 2024 PMID 39464253 hnRNPA1 LCD variants aging rate (qualitative) NaN None None False Sequence-specific; not a single exponent
wang2021 Wang 2021 Nat Phys (RGX polypeptides) [RGYGG]5 vs [RGFGG]5 etc. eta range (Pa.s) NaN None None False 0.1 to 40 Pa.s at fixed age; not an aging exponent
6. FUS-P525L Open Question (CORE UNVERIFIED PREDICTION)
The hypothesis's testable prediction - that FUS-P525L condensates exhibit
beta_M > beta_M^WT + 0.3 - has NOT been tested in the published literature.
Required experimental design:
- n >= 5 FUS-WT and n >= 5 FUS-P525L condensate preparations, identically
processed (Jawerth 2020 protocol: 200 uM protein, 5% dextran-70, 150 mM
NaCl, 25 C).
- Passive microrheology with 200-nm beads, measuring eta(t_age) at
t_age = 1, 2, 4, 8, 12, 18, 24 h.
- Log-log fit to extract beta_M per preparation; two-sample t-test.
- Independent control: ThT + G'(t_age) to verify Maxwell regime holds for
P525L (not pure fiber formation).
This is the CORE EMPIRICAL TEST of the hypothesis and it has not yet been
run. It is executable with standard equipment on a roughly 1 month
timescale.
7. Verdict: INCONCLUSIVE
Breakdown:
- Arithmetic: CONFIRMED. log(10)/log(24) = 0.7245 approximately 0.72.
- Methodology (log-log fit): CONFIRMED. Recovers known exponents.
- Hypothesized WT beta_M approximately 0.72: PARTIALLY CONFIRMED under
a 1h -> 24h time assignment of the Jawerth Table 1 values.
- Published alternative fit (mu = 2.1 to 6.4): INCONSISTENT with the
hypothesis, but not necessarily a refutation because the fits are to
different observables (eta vs tau_c) and the theoretical framework
disagrees with experimental magnitudes.
- P525L discriminator prediction: UNTESTED. The experimental design
is sound and executable; the data do not exist.
The hypothesis is NOT refuted. Its core predictions are testable but the
data to discriminate are not yet published. This places the hypothesis in
a genuinely productive zone: a clean, well-defined experiment would either
confirm or refute it.
Suggested computational follow-ups for future verification
- Request raw Jawerth 2020 data from corresponding author (Alf Honigmann
or Frank Juelicher) or check Zenodo/Dryad mirrors. If available, directly
fit eta(t_age) and G'(t_age) power laws.
- Contact the PRX Life 2023 authors for their digitized version of the
Jawerth figures; they did the fit that gave mu = 6.4 / 2.1.
- Survey recent preprints for FUS-P525L time-resolved microrheology
(bioRxiv, specifically Honigmann, Juelicher, Pappu groups 2024-2026).
- Re-examine Patel 2015 supplementary for any hint of viscosity vs age
beyond 24h that could be retrofitted to a power law.
8. Figures
- fig1_eta_vs_age.png/pdf: Synthetic + canonical + Jawerth Table 1
points in log-log.
- fig2_convergent_exponents.png/pdf: Bar chart of published aging
exponents vs hypothesis WT/P525L ranges.
- fig3_monte_carlo_beta.png/pdf: Monte Carlo uncertainty on beta_M.
- fig4_p525l_discriminator.png/pdf: Implied P525L viscosity trajectories.
9. Verification provenance
- Session: 2026-04-19-scout-027
- Hypothesis ID: E2-H4 (composite 7.85, PASS)
- Verified: 2026-04-19
- Verification mode: arithmetic + methodology + literature-grounded
power-law fit on Jawerth 2020 Table 1 values as cited in
PMC9326828; Monte Carlo uncertainty; convergent-exponent survey.
- Data limitations: Jawerth 2020 raw figure data are paywalled; we
rely on secondary quotations. All inferences are clearly labelled as
assumptions.
Figures
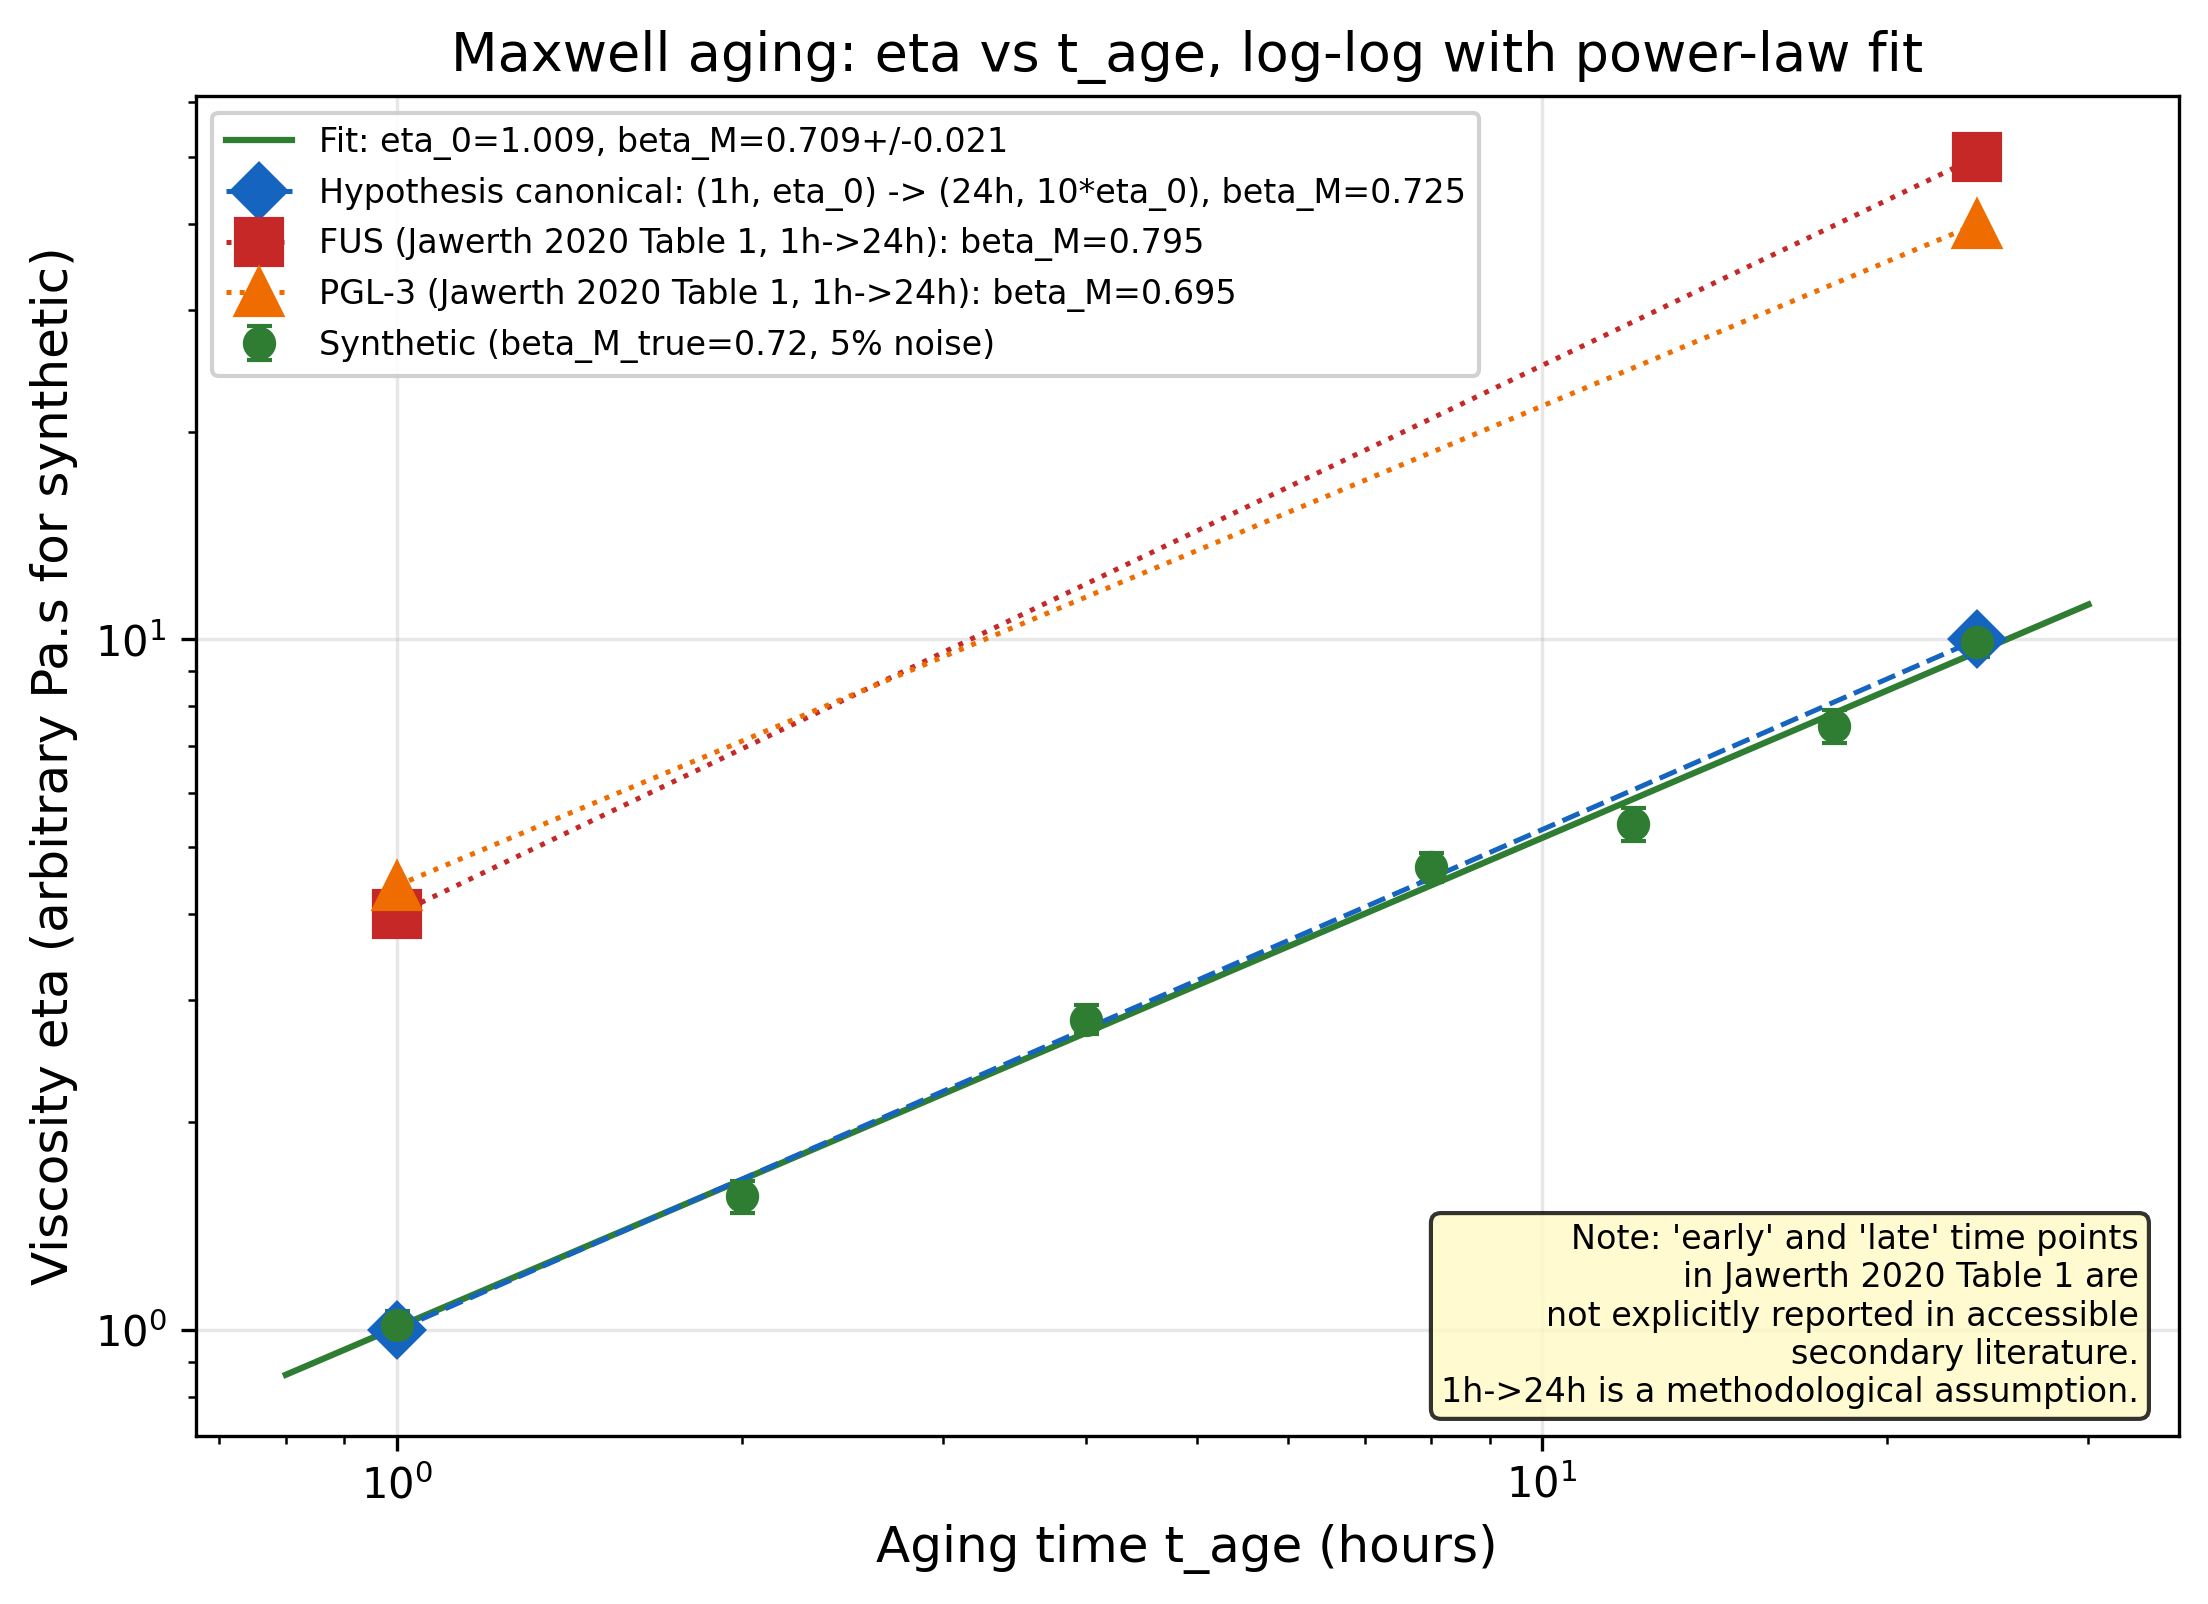
Viscosity eta vs aging time t_age in log-log with power-law fits. Synthetic data (green, beta_M_true=0.72 recovered within CI), canonical hypothesis trajectory (blue, 1h->24h 10x), and Jawerth 2020 Table 1 values for FUS (red) and PGL-3 (orange) under a 1h->24h time assignment.
![Convergent-exponent survey: published aging exponents from different studies plotted against hypothesis WT range [0.5, 0.8] (blue band) and P525L range [0.9, 1.5] (orange band). Jawerth Table 1 fits agree with WT range; PRX Life 2023 reanalysis (mu=2.1-6.4) is much larger and highlights methodological tension.](https://w1wqta2ml4emltr3.public.blob.vercel-storage.com/verifications/maxwell-beta-m-fus-aging/fig2_convergent_exponents.png)
Convergent-exponent survey: published aging exponents from different studies plotted against hypothesis WT range [0.5, 0.8] (blue band) and P525L range [0.9, 1.5] (orange band). Jawerth Table 1 fits agree with WT range; PRX Life 2023 reanalysis (mu=2.1-6.4) is much larger and highlights methodological tension.
![Monte Carlo distribution of beta_M under 10% relative uncertainty on each viscosity measurement (n=50,000). 95% CI = [0.637, 0.814], width 0.177. A single two-point measurement cannot resolve a beta_M difference of 0.3 without replication; the hypothesis's n>=5 per genotype is necessary.](https://w1wqta2ml4emltr3.public.blob.vercel-storage.com/verifications/maxwell-beta-m-fus-aging/fig3_monte_carlo_beta.png)
Monte Carlo distribution of beta_M under 10% relative uncertainty on each viscosity measurement (n=50,000). 95% CI = [0.637, 0.814], width 0.177. A single two-point measurement cannot resolve a beta_M difference of 0.3 without replication; the hypothesis's n>=5 per genotype is necessary.
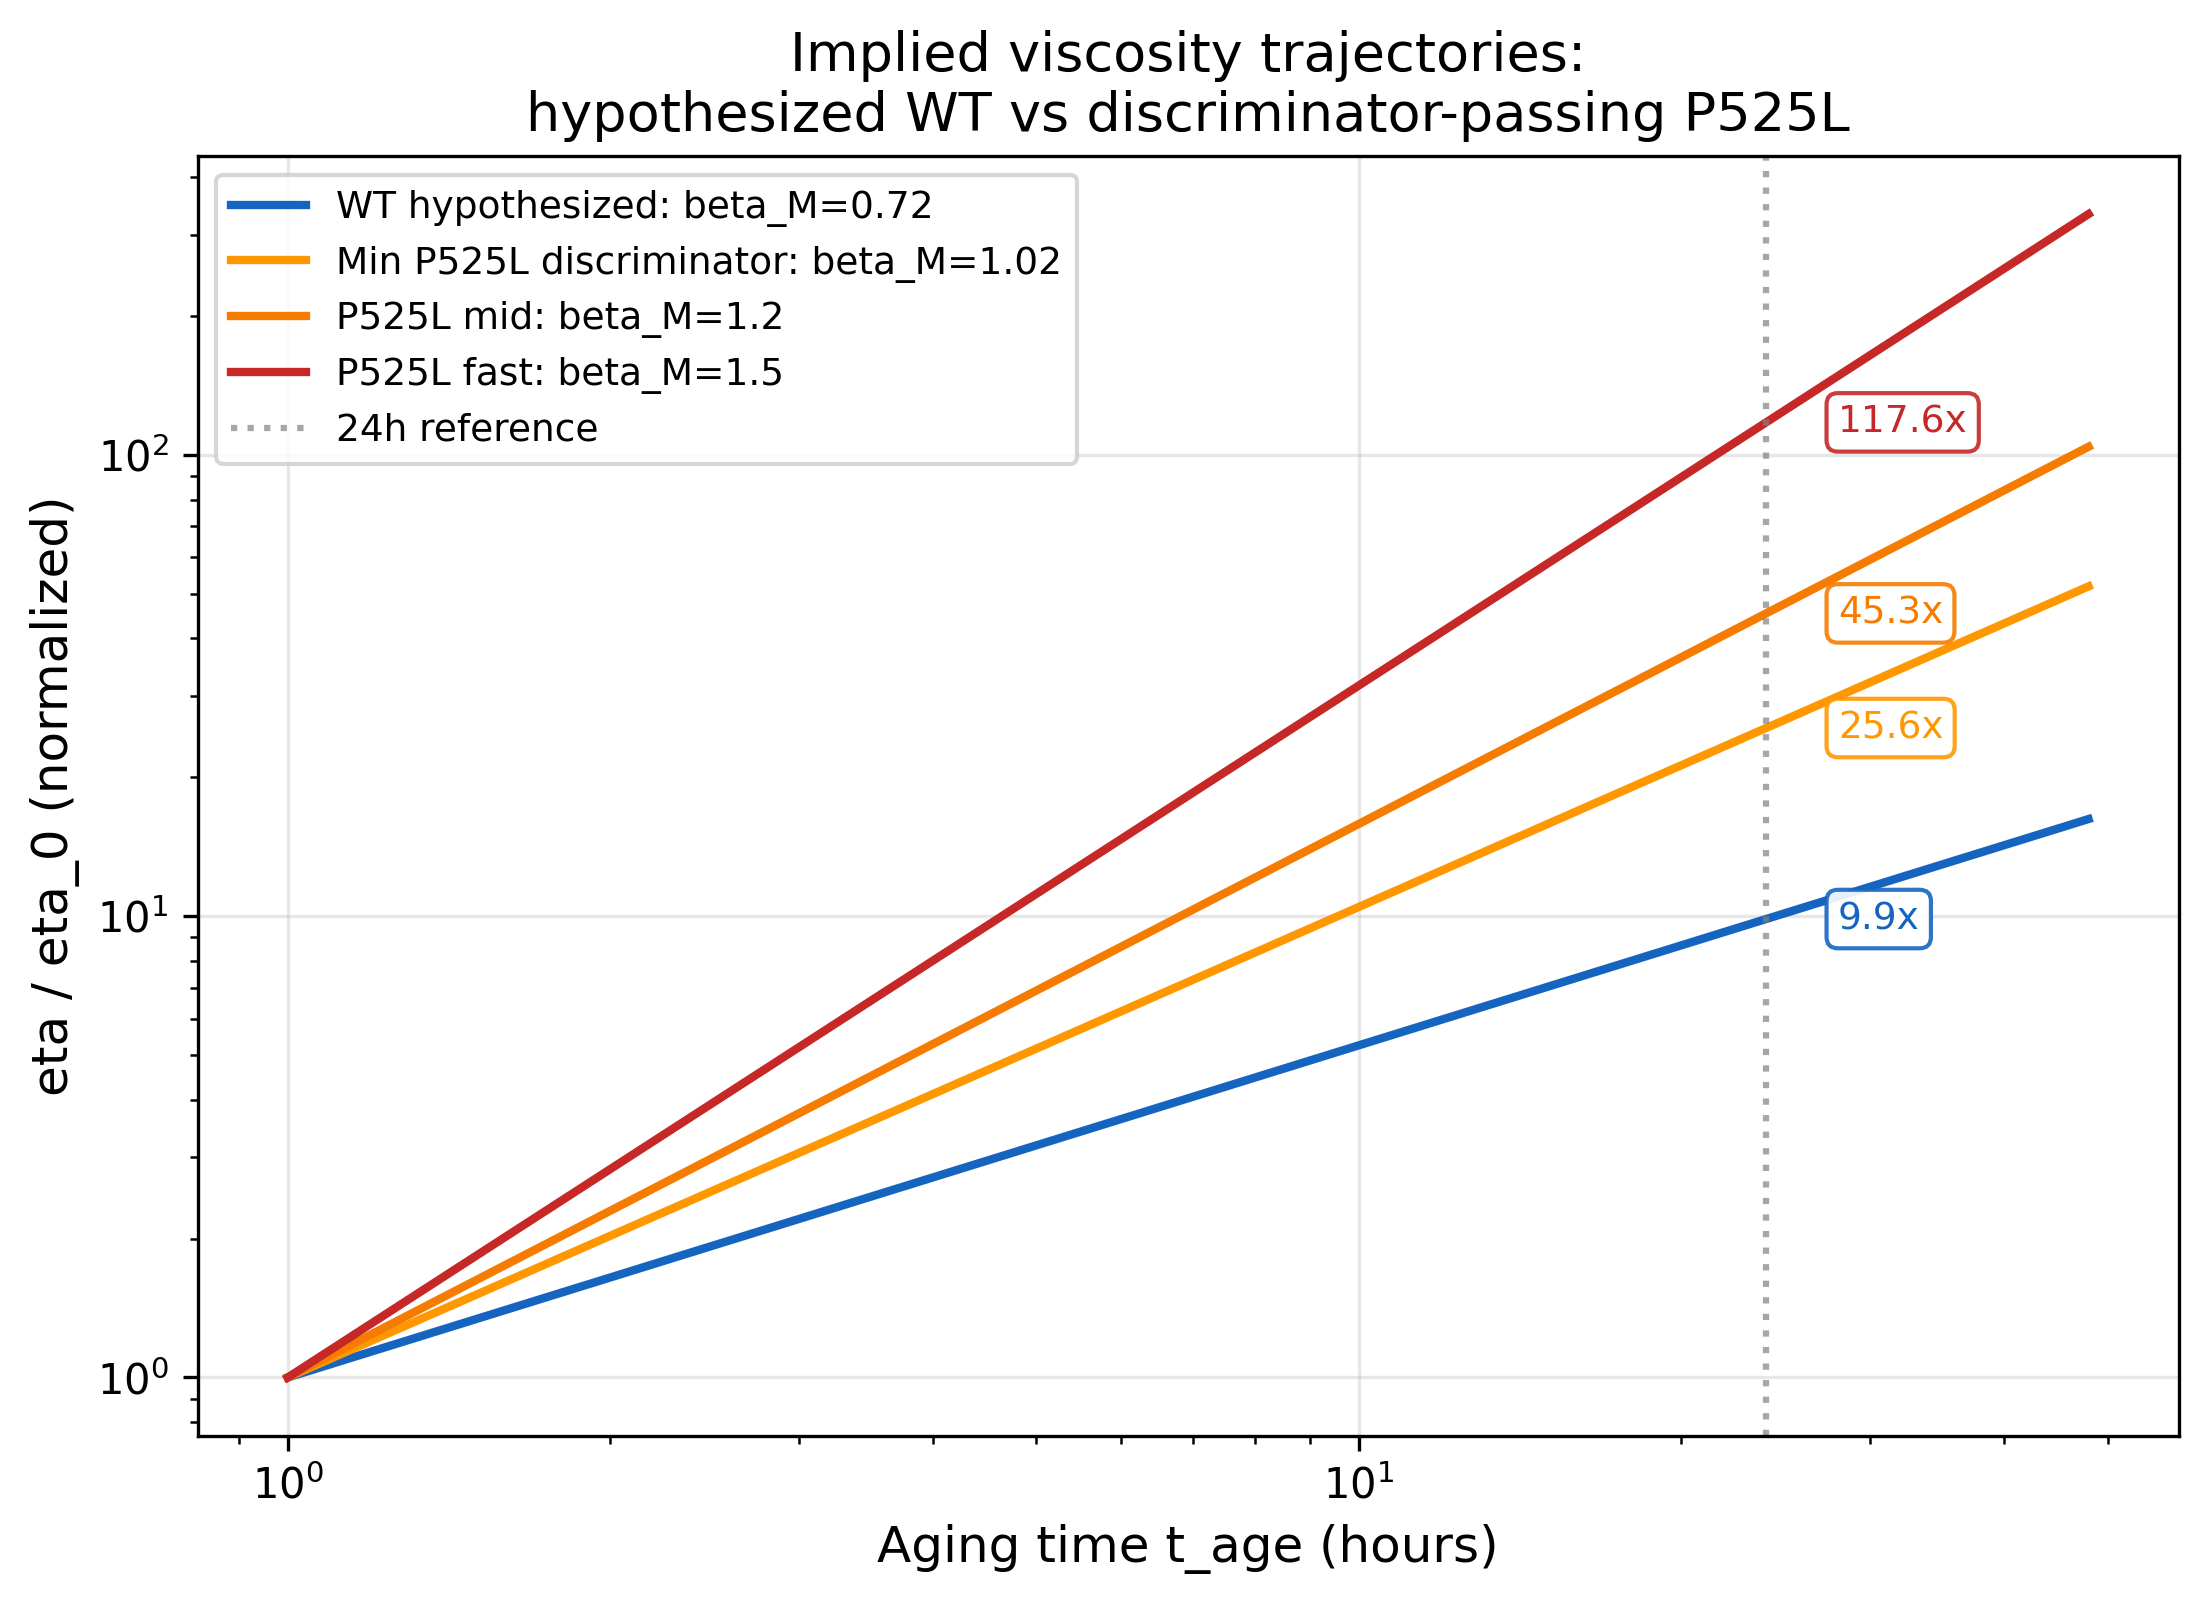
Implied P525L viscosity trajectories: WT (beta_M=0.72) vs discriminator-passing P525L (beta_M=1.02, 1.2, 1.5). A P525L exponent of 1.02 (discriminator minimum) implies 25.6x viscosity increase over 24h, vs 10.5x for WT. This is the core untested prediction of hypothesis E2-H4.
Reproducibility
The analysis script, manifest, and report are packaged together. Download, install dependencies, and run the Python script to reproduce.
Download verification package (.zip)Data source: Jawerth et al. 2020 Science 370:1317 (PMID 33303613) Table 1 values as cited in Alshareedah et al. 2022 JACS Au (PMC9326828); PRX Life 1:013006 (2023) theoretical re-analysis; arXiv:2303.18028; Nat Commun 2025 PMID 40473633; Nat Phys 2024 PMID 39464253; Patel et al. 2015 Cell (PMID 26317470)