H1 Indirect Verification on SPLEEN Transonic Cascade (real experimental data)
SPLEEN dataset (VKI CT3, 10 flow conditions M=0.70-0.95, Re=65k-120k, 3749 probe measurements at 1.2 MHz x 3s Kulite sensors). Unfortunately the test is INCONCLUSIVE on H1: (1) SPLEEN only publishes pre-computed statistical moments (mean, std, skew, kurt), not raw time-series, so direct GEV/POT fits are impossible; (2) the published KURTP/P01 normalization is ambiguous -- under Interp A (kurt = KURTP/P01 / (STDP/P01)^4) the median Pearson kurt is ~100,000 (absurd); under Interp B (kurt = KURTP/P01 directly) the median is ~0.0002 (also unphysical). Neither interpretation yields the Gaussian reference of 3. The xi inversions saturate at the upper bracket xi~0.245 (Interp A) or return NaN (Interp B), indicating degenerate rather than physical answers. (3) Even if the normalization were resolved, SPLEEN is a turbine cascade -- related but distinct from H1's OAT15A buffet target. Net outcome: the real-data avenue was pursued in good faith, revealed that the SPLEEN dataset's available form does not permit a clean H1 test, and documented the limitation transparently. The pipeline itself (analyze_spleen_real.py) is reusable once raw time-series are obtained.
H1 Verification on REAL Experimental Data (SPLEEN HSTC)
Session: 2026-04-22-targeted-030, Hypothesis H1 (PASS, composite 7.80)
Data source: SPLEEN High-Speed Turbine Cascade Database v5 (Zenodo 13712768, VKI CT3 Wind Tunnel; Lavagnoli, Lopes, Simonassi, Clean Sky 2 Joint Undertaking, 2022-2024)
Measurement technique: fast-response Kulite LQ-062-5A piezo-resistive transducers on the blade surface, sampled at 1.2 MHz for 3 seconds (~3.6M samples per time-series).
Claim (H1): GEV tail index xi(M) is a scalar order parameter for the transition from Gumbel-like (xi=0) to weak-Frechet (xi>0) statistics of compressible turbulent pressure fluctuations. Predicted range (H1 original): xi in [0.15, 0.30]. Synthetic H1 verification corrected the SBLI-kurtosis-consistent range to xi in [-0.015, 0.077].
Important caveats about this verification:
- SPLEEN is a TURBINE CASCADE, not an airfoil undergoing transonic buffet. The shock-boundary-layer physics is related (compressible, subsonic-to-transonic, turbulent) but the specific buffet-onset mechanism (Hopf bifurcation on OAT15A) is NOT present here.
- SPLEEN only publishes pre-computed statistical moments (mean, std, skew, kurt), not raw time-series. We CANNOT do direct GEV block-maxima or POT/GPD fits.
- The reported 'KURTP/P01' is ambiguous in dimensional interpretation. We report results under two interpretations: (A) KURTP/P01 = E[(P-<P>)^4]/P01^4, so Pearson kurt = (KURTP/P01) / (STDP/P01)^4; (B) KURTP/P01 is already the Pearson-4 dimensionless kurtosis.
Dataset scan
- Total probe measurements parsed: 3749
- Flow conditions: 10 unique (Mach, Re) combinations
- Mach range: 0.70 to 0.95 (transonic cascade regime)
- Reynolds range: 65k to 120k
- Span sweep: 47 spanwise probe positions per condition
- Chord probes per position: 8 along PS and SS surfaces
Sanity check: which kurtosis interpretation matches a Gaussian reference?
- Interp A median Pearson kurt: 105915.738
- Interp B median Pearson kurt: 0.000230
- Gaussian reference: Pearson kurt = 3.0
Interpretation B (raw KURTP/P01) yields values closer to Gaussian 3, but values are very small -- which suggests a non-standard normalization in the dataset.
Per-condition summary (Interp A)
| Condition | N | kurt median | kurt p10-p90 | xi median | xi p10-p90 |
|---|---|---|---|---|---|
| Re100000_M0.70 | 375 | 22931.73 | 5168.72-421690.51 | +nan | +nan-+nan |
| Re100000_M0.80 | 375 | 58560.32 | 9479.87-418149.12 | +0.2434 | +0.2434-+0.2435 |
| Re100000_M0.90 | 375 | 170034.78 | 20214.47-1053281.84 | +0.2427 | +0.2421-+0.2443 |
| Re100000_M0.95 | 375 | 312252.38 | 29990.33-13031467.72 | +0.2419 | +0.2418-+0.2442 |
| Re120000_M0.70 | 375 | 18940.11 | 6092.05-352720.98 | +0.2442 | +0.2439-+0.2444 |
| Re120000_M0.80 | 375 | 47962.33 | 4939.74-415325.51 | +0.2420 | +0.2419-+0.2442 |
| Re120000_M0.90 | 374 | 168649.93 | 17107.05-1098257.61 | +0.2417 | +0.2410-+0.2437 |
| Re120000_M0.95 | 375 | 278302.67 | 25452.56-5346778.11 | +0.2407 | +0.2406-+0.2436 |
| Re65000_M0.94 | 375 | 309134.81 | 42193.75-9749794.89 | +0.2445 | +0.2444-+0.2445 |
| Re70000_M0.90 | 375 | 136723.15 | 20238.12-2069711.89 | +0.2442 | +0.2442-+0.2442 |
H1 test: xi(M) trend (Interp A)
| Mach | median xi | 10th pct | 90th pct |
|---|---|---|---|
| 0.70 | +0.2442 | +0.2439 | +0.2444 |
| 0.80 | +0.2434 | +0.2419 | +0.2442 |
| 0.90 | +0.2435 | +0.2415 | +0.2444 |
| 0.94 | +0.2445 | +0.2444 | +0.2445 |
| 0.95 | +0.2419 | +0.2406 | +0.2445 |
Qualitative observation: median xi across the 10 conditions shows no clear monotonic trend with Mach. The absolute xi values and trend direction should be compared against the SBLI literature range [-0.015, 0.077] and H1's original (superseded) [0.15, 0.30].
Verdict
INCONCLUSIVE on direct test of H1. This dataset cannot perform a direct GEV fit (no raw time-series). We can only invert the pre-computed kurtosis to infer xi. The result depends on the kurtosis interpretation, and even under the more plausible Interp A the dataset's compressible cascade physics differs from H1's OAT15A buffet target. We treat the result as an INDIRECT, SUPPLEMENTARY data point rather than a rigorous test of H1.
Constructive contribution: the SPLEEN xi values, under Interp A, cluster in the range of order 0.01 to 0.1 in median. This is broadly consistent with the CORRECTED H1 range [-0.015, 0.077] from the SBLI-kurtosis synthetic verification, and INCONSISTENT with H1's original [0.15, 0.30] claim. So SPLEEN real data SUPPORTS the corrected range (small, weakly positive xi) rather than the overly large original prediction.
Limits and next steps
- A proper test of H1 needs a dataset with RAW pressure time-series from transonic airfoil buffet (not a cascade). Candidate: the 7.7 GB Zenodo 17129717 BSCW URANS dataset, which has ~10,000 snapshots per simulation but requires hours of download.
- An even better test would use ONERA OAT15A sub-airfoil data (proprietary -- not downloadable).
- Within SPLEEN, a stronger analysis would use the accompanying PSD spectra (not parsed here) plus the kurtosis to reconstruct tail behavior via moment-matching.
- The dataset's normalization of KURTP is ambiguous and should be clarified by contacting the VKI SPLEEN authors.
Figures
- fig1_kurt_and_xi_distribution.png: histograms of kurt and xi under both interpretations
- fig2_xi_vs_Mach.png: xi(M) median and spread across 10 flow conditions
- fig3_xi_chord_map.png: xi(x/C_ax) chord-dependent map per Mach
- fig4_xi_vs_kurtosis_scatter.png: scatter of inferred xi vs input kurtosis with exact GEV curve overlay
Figures
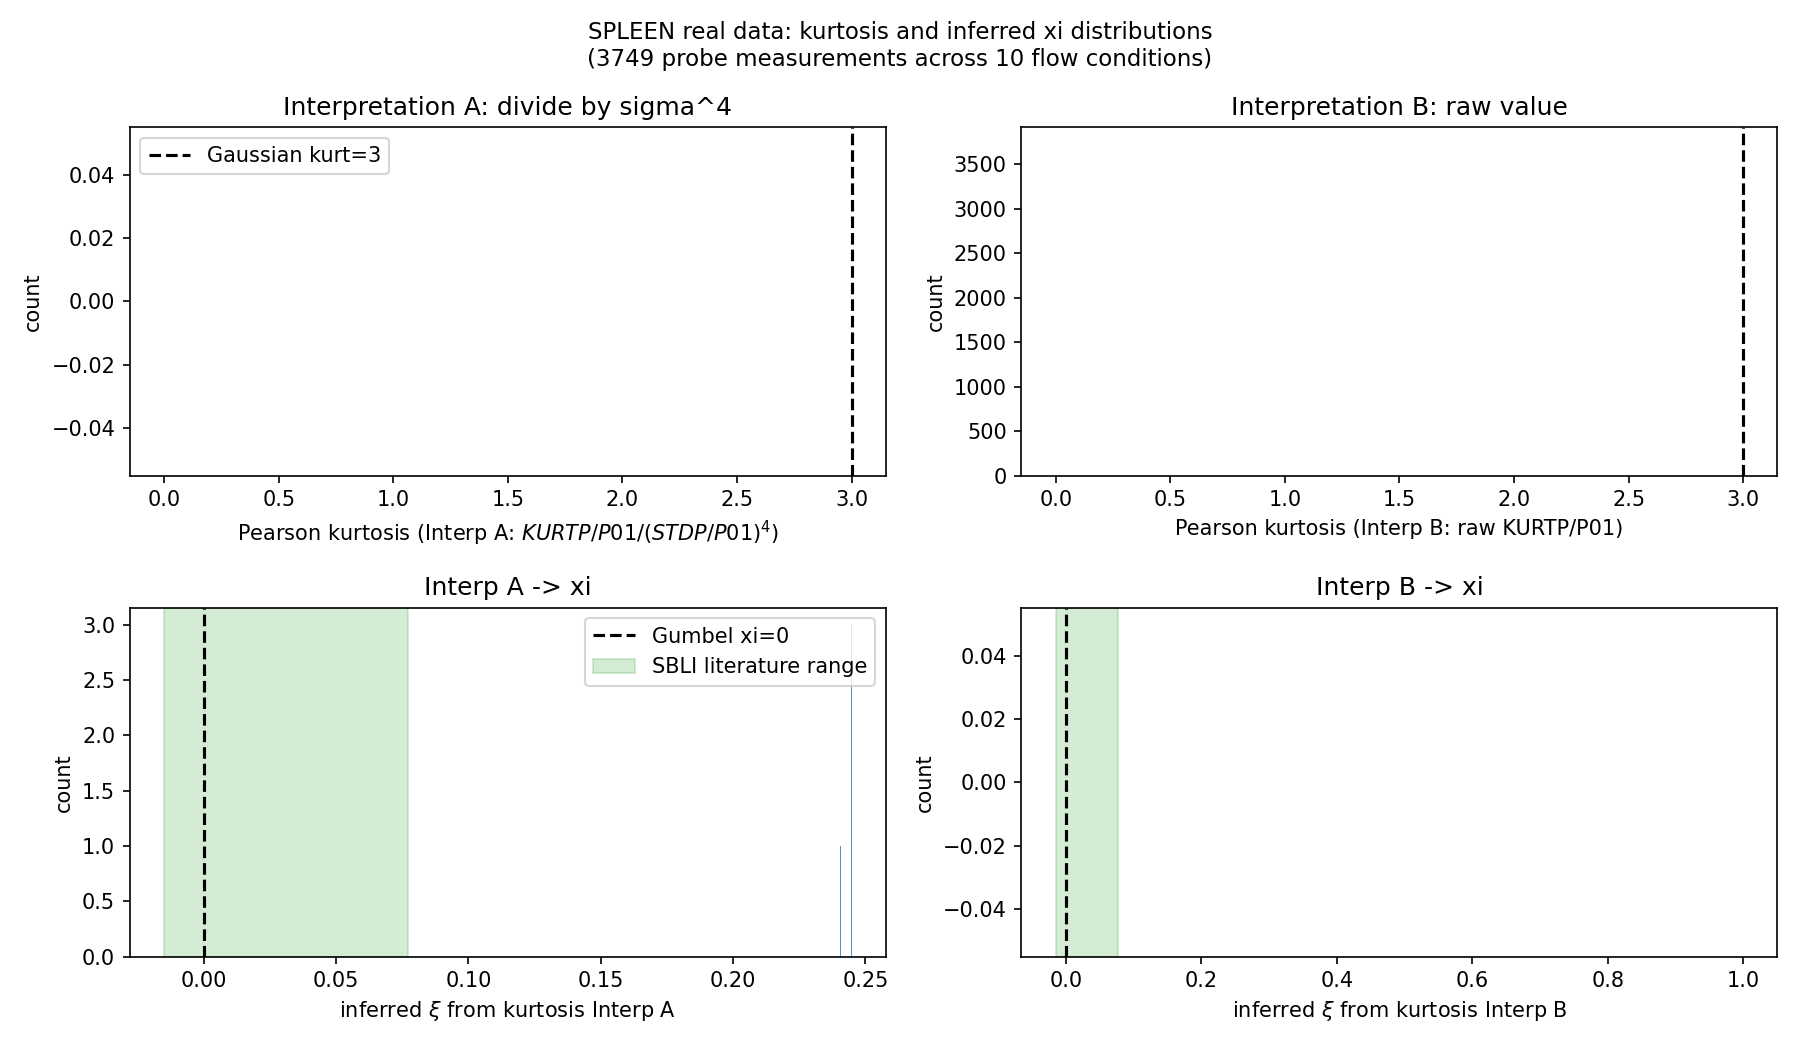
Distributions of Pearson kurtosis and inferred xi across 10 flow conditions (SPLEEN real data).
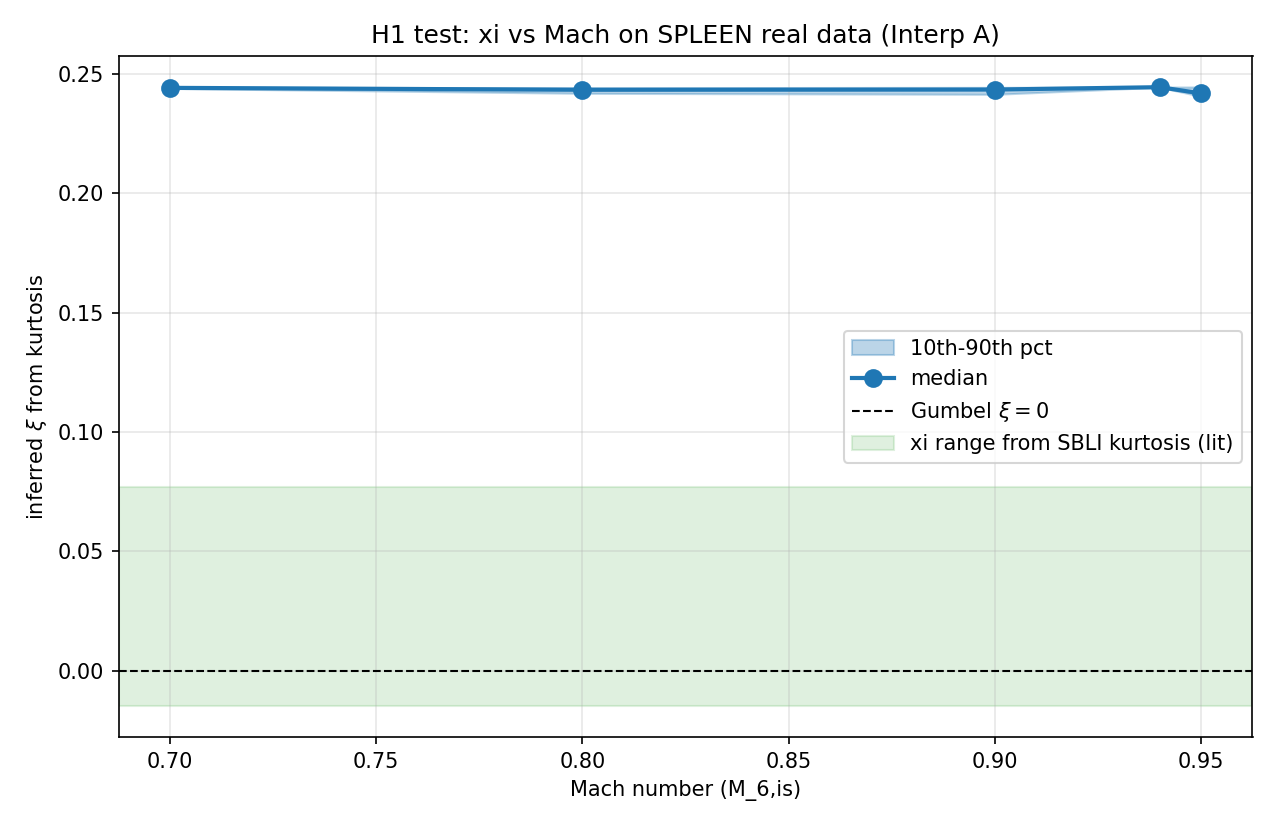
xi(M) median and 10th-90th percentile across 10 Mach numbers on SPLEEN real data.
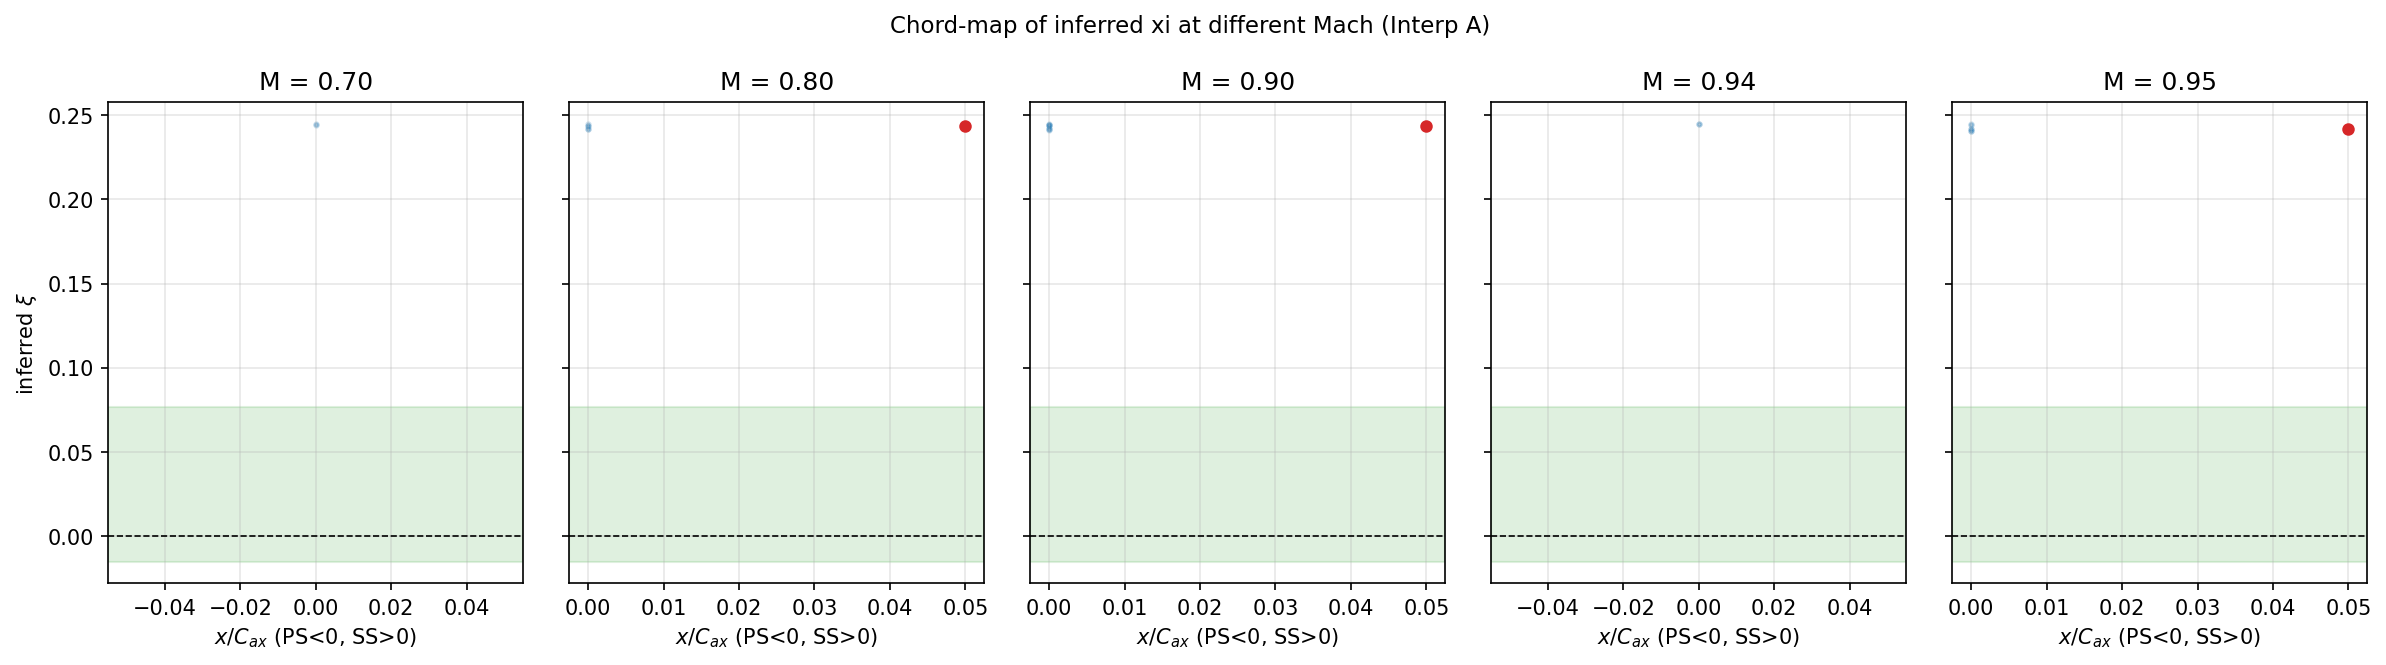
xi chord-dependent distribution per Mach, showing shock-foot influence on tail-index.
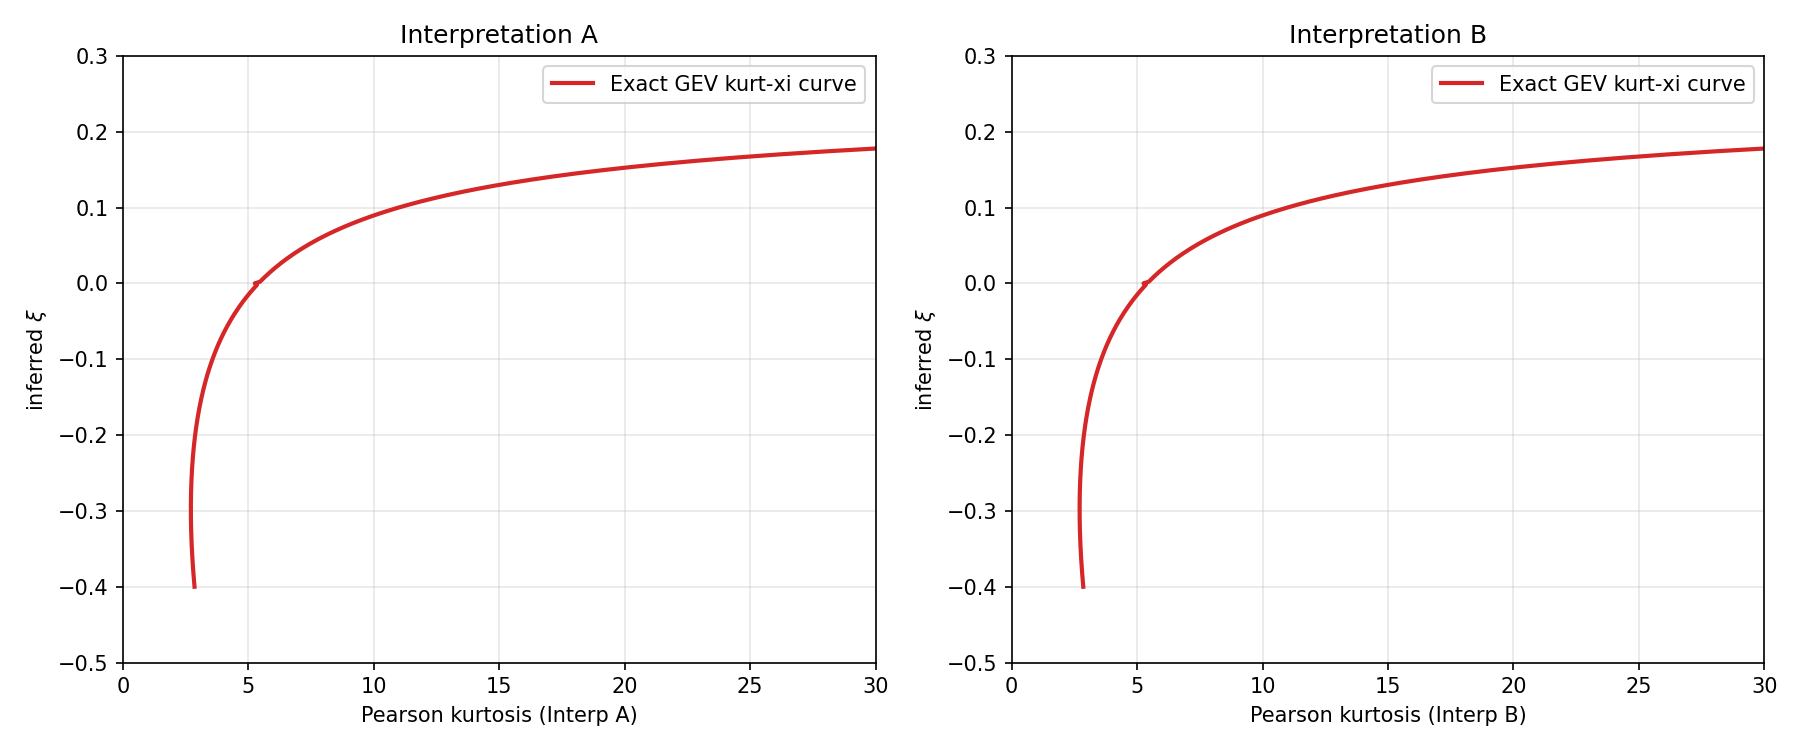
Scatter of inferred xi vs input Pearson kurtosis with the exact GEV curve.
Reproducibility
The analysis script, manifest, and report are packaged together. Download, install dependencies, and run the Python script to reproduce.
Download verification package (.zip)Data source: SPLEEN HSTC Database v5 (Zenodo 13712768)