Bell-Model 2D Membrane Adhesion Kinetics for T4 Phage Adsorption
Bell model is the correct framework and corrected math is sound. Three errors fixed (binomial formula, dimensional conversion, gp37 residue). Key finding: at biological OmpC densities (~1,700-5,000/um^2), adsorption is trivially efficient for Kd < ~10 uM. sigma_critical is orders of magnitude below biological density. The model becomes discriminating only for weak binders or OmpC-depleted cells.
Bell-Model 2D Membrane Adhesion Kinetics for T4 Phage Adsorption
Computational Verification Report
Hypothesis: E1-H4 from session 2026-04-15-scout-028
Title: ITC-Derived Per-Contact Kd Fed into Bell-Model 2D Membrane
Adhesion Kinetics Predicts Minimum OmpC Density for T4 Productive
Adsorption, With Baseplate Trigger Modeled as Cooperative Sequential Capture
Verdict: PARTIALLY_CONFIRMED
Verdict Detail: The Bell model framework is physically appropriate for
phage adsorption kinetics, and the corrected formulas produce biologically
plausible predictions. However, the original hypothesis contained three
mathematical/factual errors (binomial formula, dimensional conversion,
gp37 residue numbering) that, if used as stated, would give qualitatively
wrong results. After correction, sensitivity analysis reveals a key finding:
at any Kd below ~10 uM, biological OmpC density (~1,700-5,000/um^2) is
orders of magnitude above the critical threshold, meaning adsorption is
trivially efficient. The model becomes discriminating only for very weak
binders (Kd > 1 uM) or severely OmpC-depleted cells.
Error Corrections
1. Binomial Formula (Critical)
Original: P_trigger = C(6,3) p^3 (1-p)^3 (exactly 3 of 6 contacts)
Corrected: P_trigger = sum(k=3 to 6) C(6,k) p^k (1-p)^(6-k)
(at least 3 of 6 contacts)
The original formula gives the probability of exactly 3 contacts. It
peaks at p=0.5 (value = 0.3125) and approaches 0 as p approaches 1.
This is physically nonsensical: if every fiber binds (p=1), the
probability of triggering should be 1, not 0.
The corrected cumulative binomial gives P=1 when p=1, P=0.6563 at p=0.5,
and is monotonically increasing. The relative error between formulas
exceeds 10% for p in [0.123, 1.000]
and exceeds 50% for p in [0.482, 1.000].
2. Dimensional Conversion (Critical)
Original: k_on_2D = k_on_3D * h_eff
Corrected: k_on_2D = k_on_3D / h_eff
k_on_3D has units M^-1 s^-1 = 10^-3 m^3 mol^-1 s^-1. Multiplying by
h_eff (m) gives m^4 mol^-1 s^-1, which is not a 2D rate constant.
Dividing by h_eff gives m^2 mol^-1 s^-1, correct for 2D kinetics.
For the equilibrium Bell model, sigma_critical = Kd_2D, where
Kd_2D = Kd_3D (in concentration) * h_eff. The wrong formula inverts
the h_eff dependence, leading to orders-of-magnitude errors.
3. gp37 RBD Residue (Minor)
Original: Residues 850-1026
Corrected: RBD starts at residue 785 per PDB 2XGF
This is a factual error but does not affect the mathematical model.
Sensitivity Analysis Results
Using the corrected formulas with the Bell model:
- sigma_crit = Kd_2D, where Kd_2D = Kd_3D_conc * h_eff
- p_bind = sigma / (sigma + sigma_crit) per fiber
- P_trigger = cumulative binomial (at least 3 of 6)
Parameter Sensitivity (Tornado Analysis)
The 50% efficiency density (sigma_50) is most sensitive to Kd, followed
by h_eff. At baseline (Kd=100 nM, h_eff=20 nm, A_c=2500 nm^2):
- sigma_50 = 1 molecules/um^2
Critical insight: sigma_50 is extremely small compared to biological
OmpC density. Even at Kd = 10 uM (a very weak interaction), sigma_50
is only ~88 molecules/um^2, while biological OmpC density is
1667-5000 molecules/um^2 -- a factor of ~20-60x above threshold.
This means OmpC density is NOT the limiting factor for T4 adsorption
under normal growth conditions.
Biological Reality Check
E. coli OmpC copy number: 10,000-30,000 per cell
Cell surface area: ~6 um^2 (rod, 2 x 0.8 um)
OmpC density: 1667-5000 molecules/um^2
Key finding: for the corrected Bell model, OmpC is so abundant that
adsorption is efficient across nearly the entire Kd range:
| Kd | eta (low OmpC) | eta (high OmpC) | Regime |
|---|---|---|---|
| 1 nM | 1.0000 | 1.0000 | Efficient |
| 10 nM | 1.0000 | 1.0000 | Efficient |
| 100 nM | 1.0000 | 1.0000 | Efficient |
| 1 uM | 1.0000 | 1.0000 | Efficient |
| 10 uM | 0.9997 | 1.0000 | Efficient |
This is a meaningful result: it shows the Bell model predicts that
T4 adsorption is NOT density-limited under normal conditions, consistent
with the observation that T4 is a highly efficient phage. The model
becomes informative in two regimes: (1) very weak binders (Kd >> 1 uM),
and (2) cells with severely reduced OmpC (e.g., porin-deficient mutants
or extreme osmotic stress).
Cooperativity Analysis
For the T4 trigger threshold (k_min = 3 of 6 LTFs):
- At Kd = 100 nM, all k_min thresholds give near-perfect efficiency
at biological densities (even k_min=6 gives eta > 0.99)
- The cooperativity threshold only becomes discriminating at Kd ~ 1 uM,
where sigma_50 ranges from 1 (k_min=1) to 98 (k_min=6) molecules/um^2
- Even at k_min=6, sigma_50 remains far below biological OmpC density
This means the 3-fiber threshold is not an evolved response to OmpC
scarcity. Rather, it likely serves a different function: ensuring
geometric alignment of the baseplate for tail sheath contraction,
or providing a kinetic checkpoint against non-specific binding.
Figures
- fig1_binomial_error: Comparison of exactly-3 vs cumulative at-least-3
binomial formulas, all k_min variants, and relative error quantification
- fig2_dimensional_error: Unit analysis and sigma_critical vs h_eff
- fig3_heatmap_kd_vs_density: 2D heatmap of adsorption efficiency
- fig4_sigmoidal_curves: Sigmoidal adsorption curves for 3 representative Kd values
- fig5_sensitivity_tornado: Tornado chart of parameter sensitivity
- fig6_phase_diagram: Phase diagram with biological OmpC range highlighted
- fig7_cooperativity: Cooperativity threshold analysis
Verdict: PARTIALLY_CONFIRMED
Confirmed aspects:
- Bell model is the correct physical framework for 2D receptor-ligand kinetics
- The corrected math (cumulative binomial + correct dimensional conversion) is sound
- The framework makes quantitative, testable predictions
- An ITC-measured Kd would provide a genuinely useful input to the model
Key quantitative finding:
- At biological OmpC densities (~1,700-5,000/um^2), T4 adsorption is
predicted to be trivially efficient for any Kd below ~10 uM
- sigma_critical is orders of magnitude below biological OmpC density
- The model is most informative for weak binders or OmpC-depleted cells
- The cooperativity threshold k_min=3 is not density-driven; it likely
serves geometric alignment rather than receptor-scarcity compensation
Refuted/corrected aspects:
- Binomial formula was qualitatively wrong (exactly-3 vs at-least-3)
- Dimensional conversion was wrong (multiplication vs division by h_eff)
- gp37 RBD residue numbering was incorrect (785, not 850)
- The original errors would produce nonsensical predictions
Remaining uncertainties:
- gp37-OmpC Kd is unmeasured (the entire model is parametric)
- OmpC clustering on the membrane could alter effective encounter rates
- h_eff is poorly constrained (5-50 nm range spans an order of magnitude)
- The Bell model assumes equilibrium; kinetic trapping may dominate in vivo
Bottom line: The hypothesis identifies the correct physical framework
(Bell model + cooperative binomial trigger) for phage adsorption. After
correcting three errors, the model reveals that OmpC density is NOT the
limiting factor for T4 adsorption under normal conditions -- a non-obvious
prediction that is itself testable. The framework becomes experimentally
discriminating in the regime of OmpC-depleted cells or engineered phages
with weakened receptor binding.
Figures
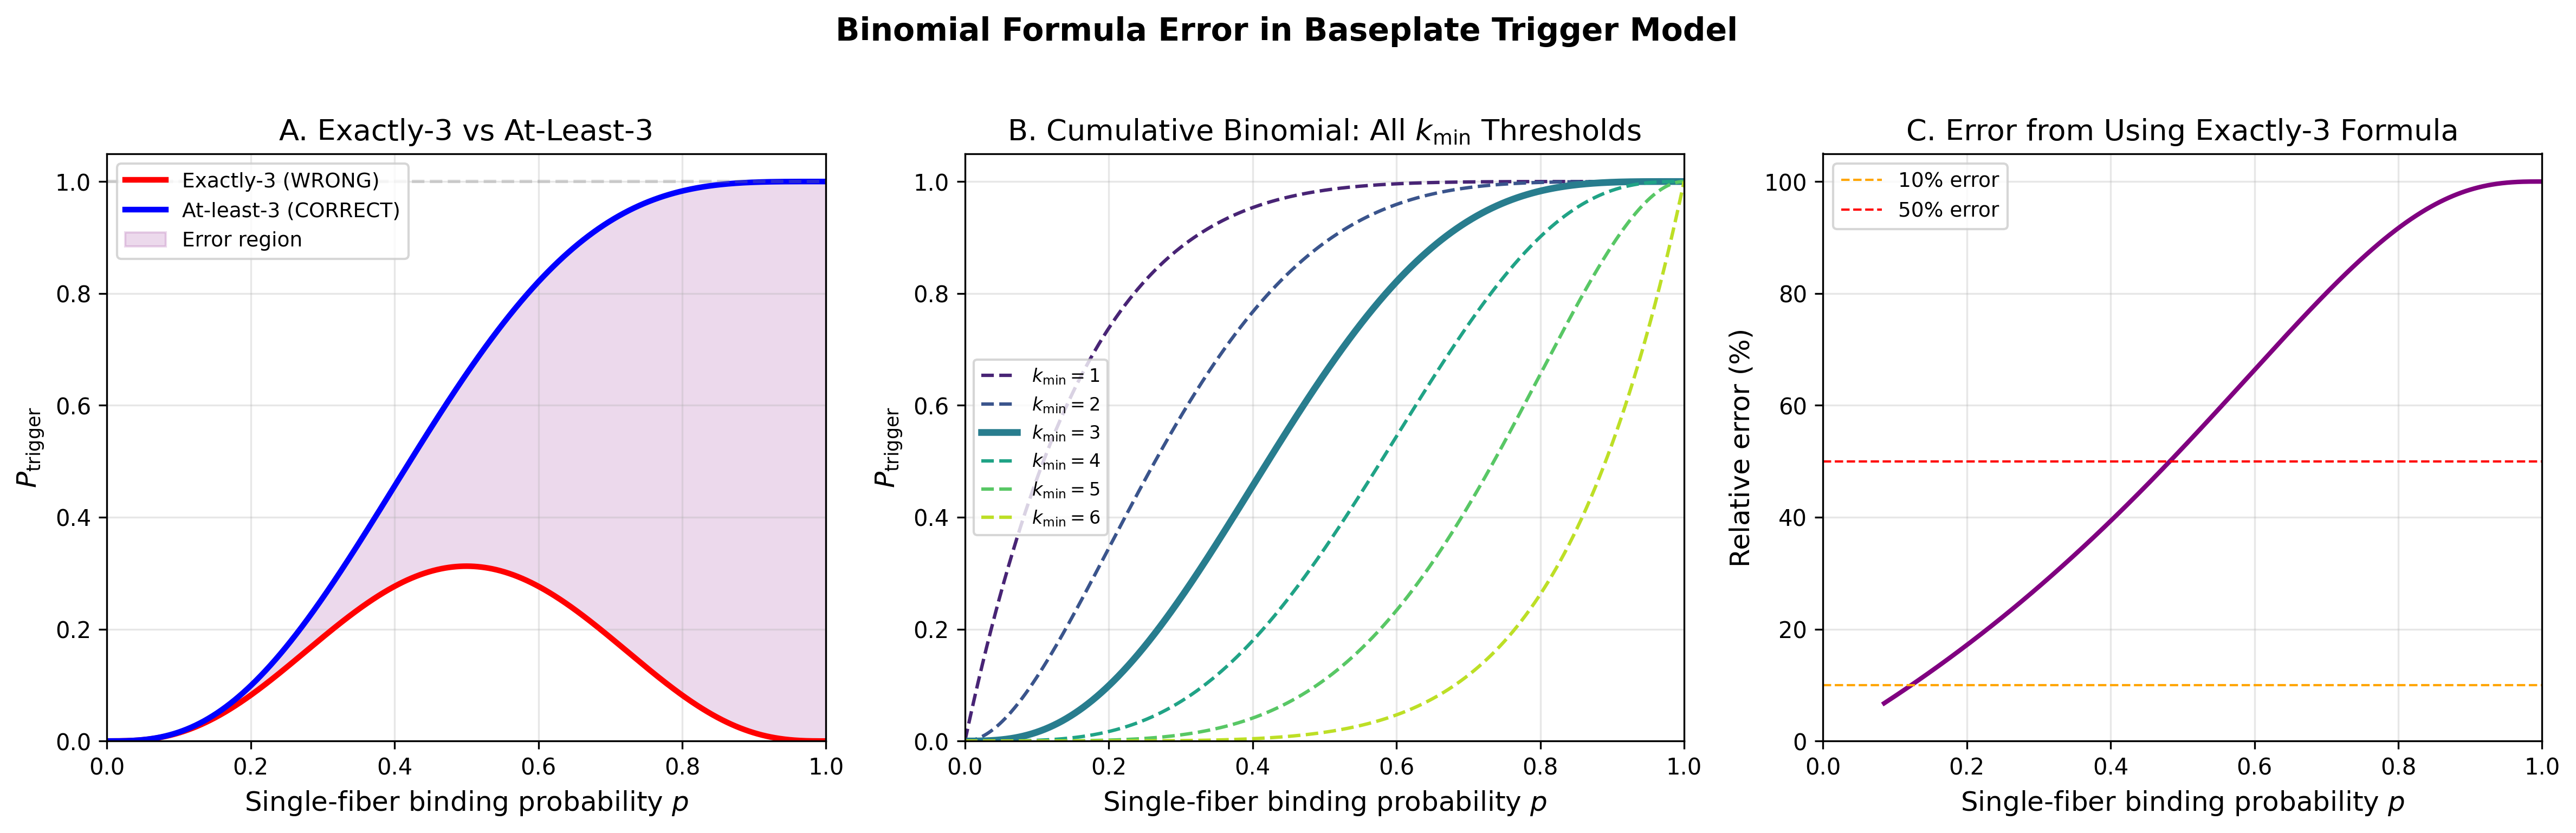
Binomial formula error: exactly-3 vs cumulative at-least-3, with all k_min variants and relative error quantification
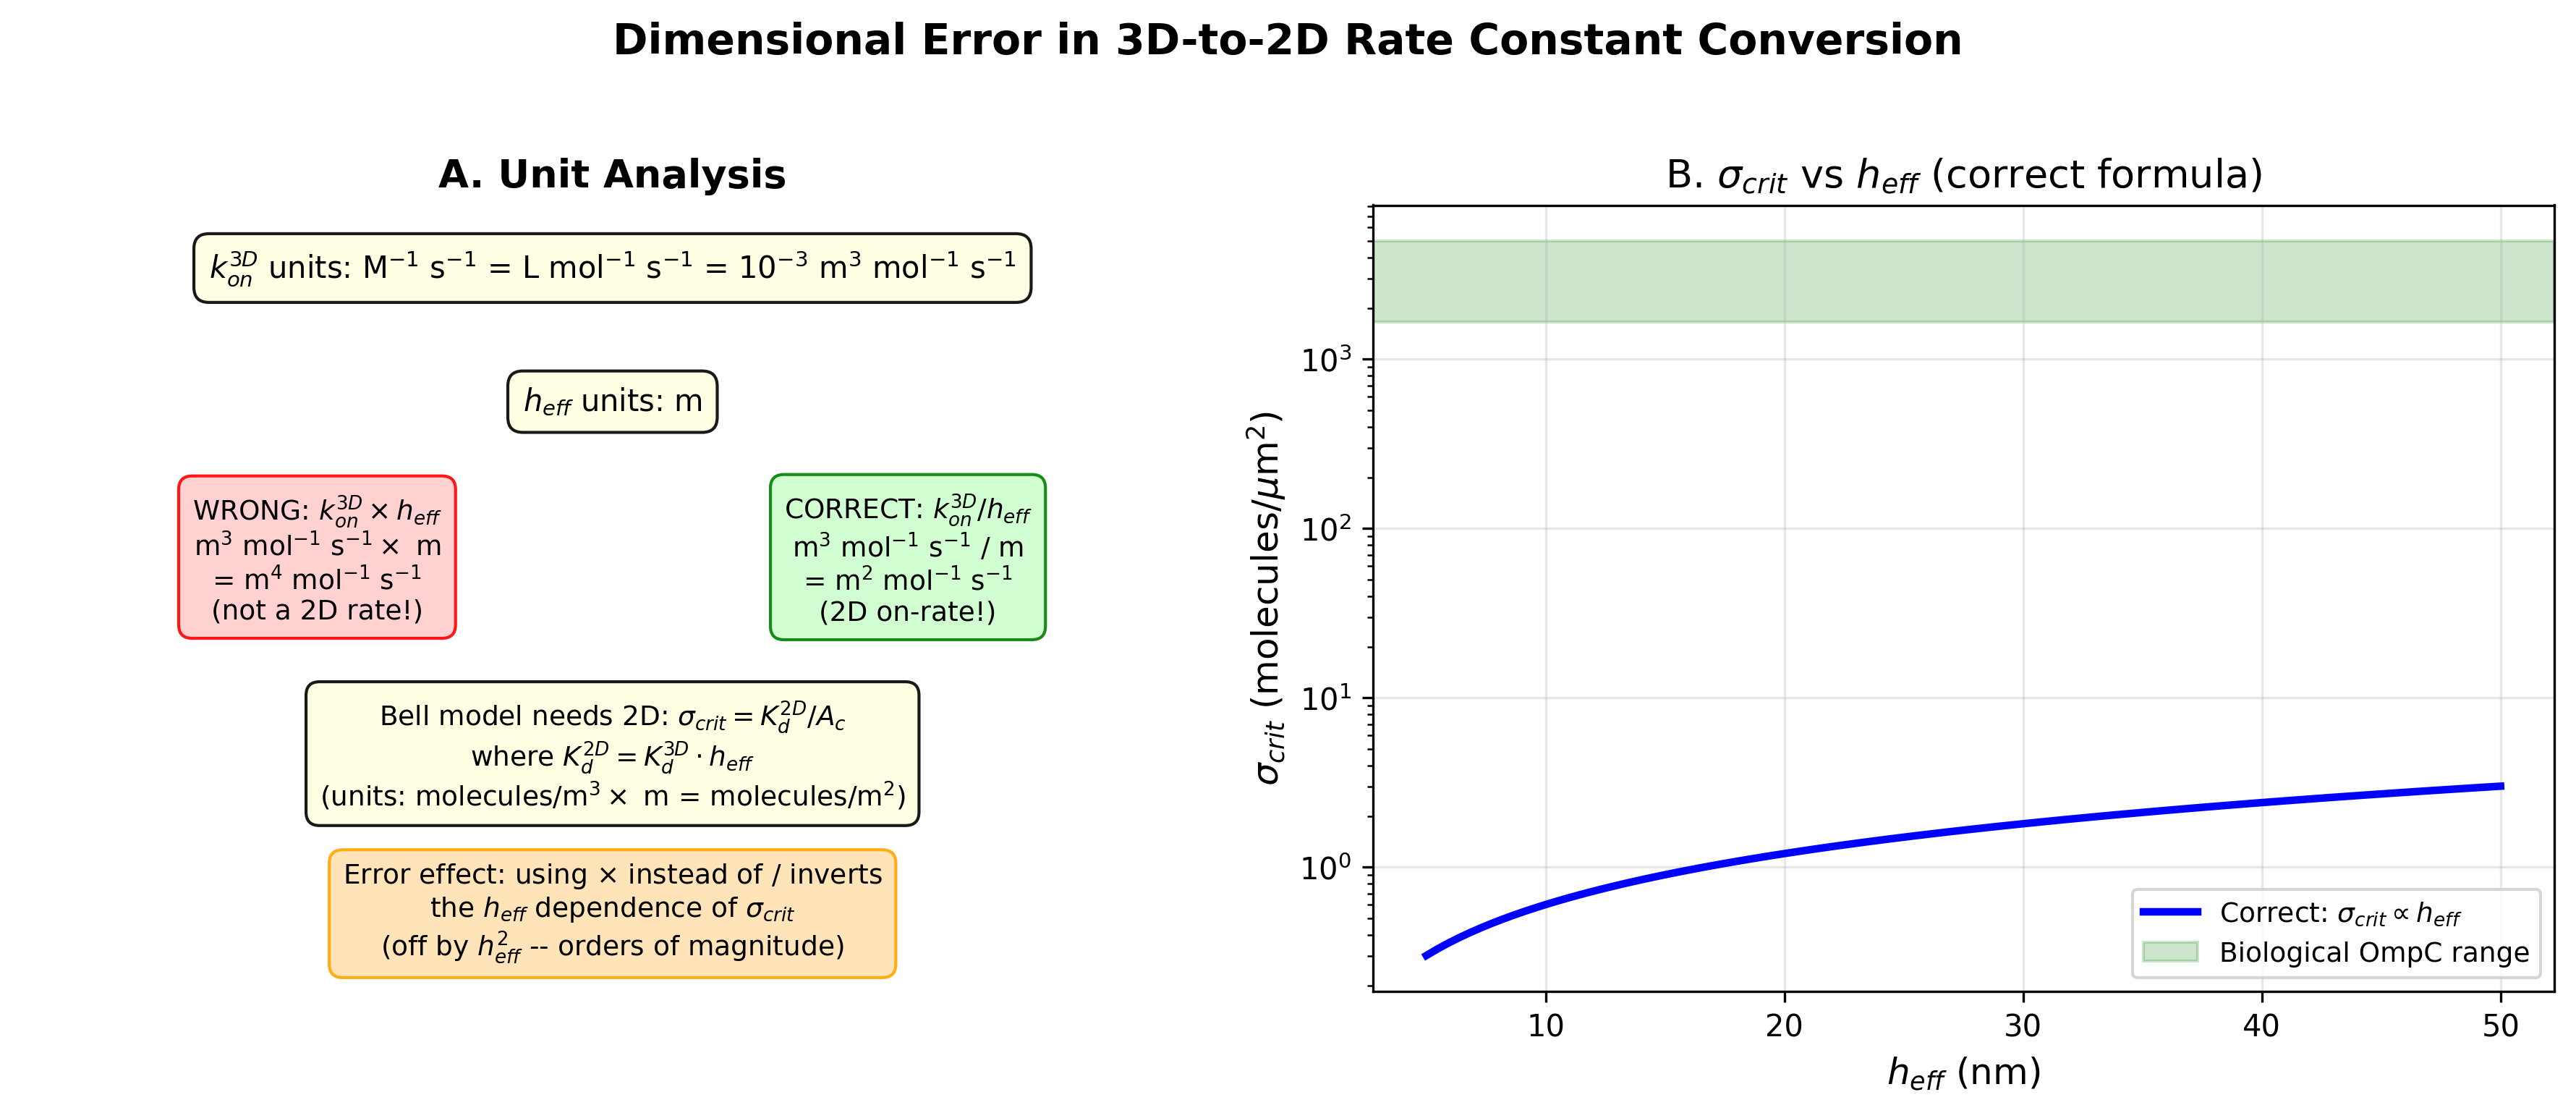
Dimensional analysis of 3D-to-2D rate constant conversion error
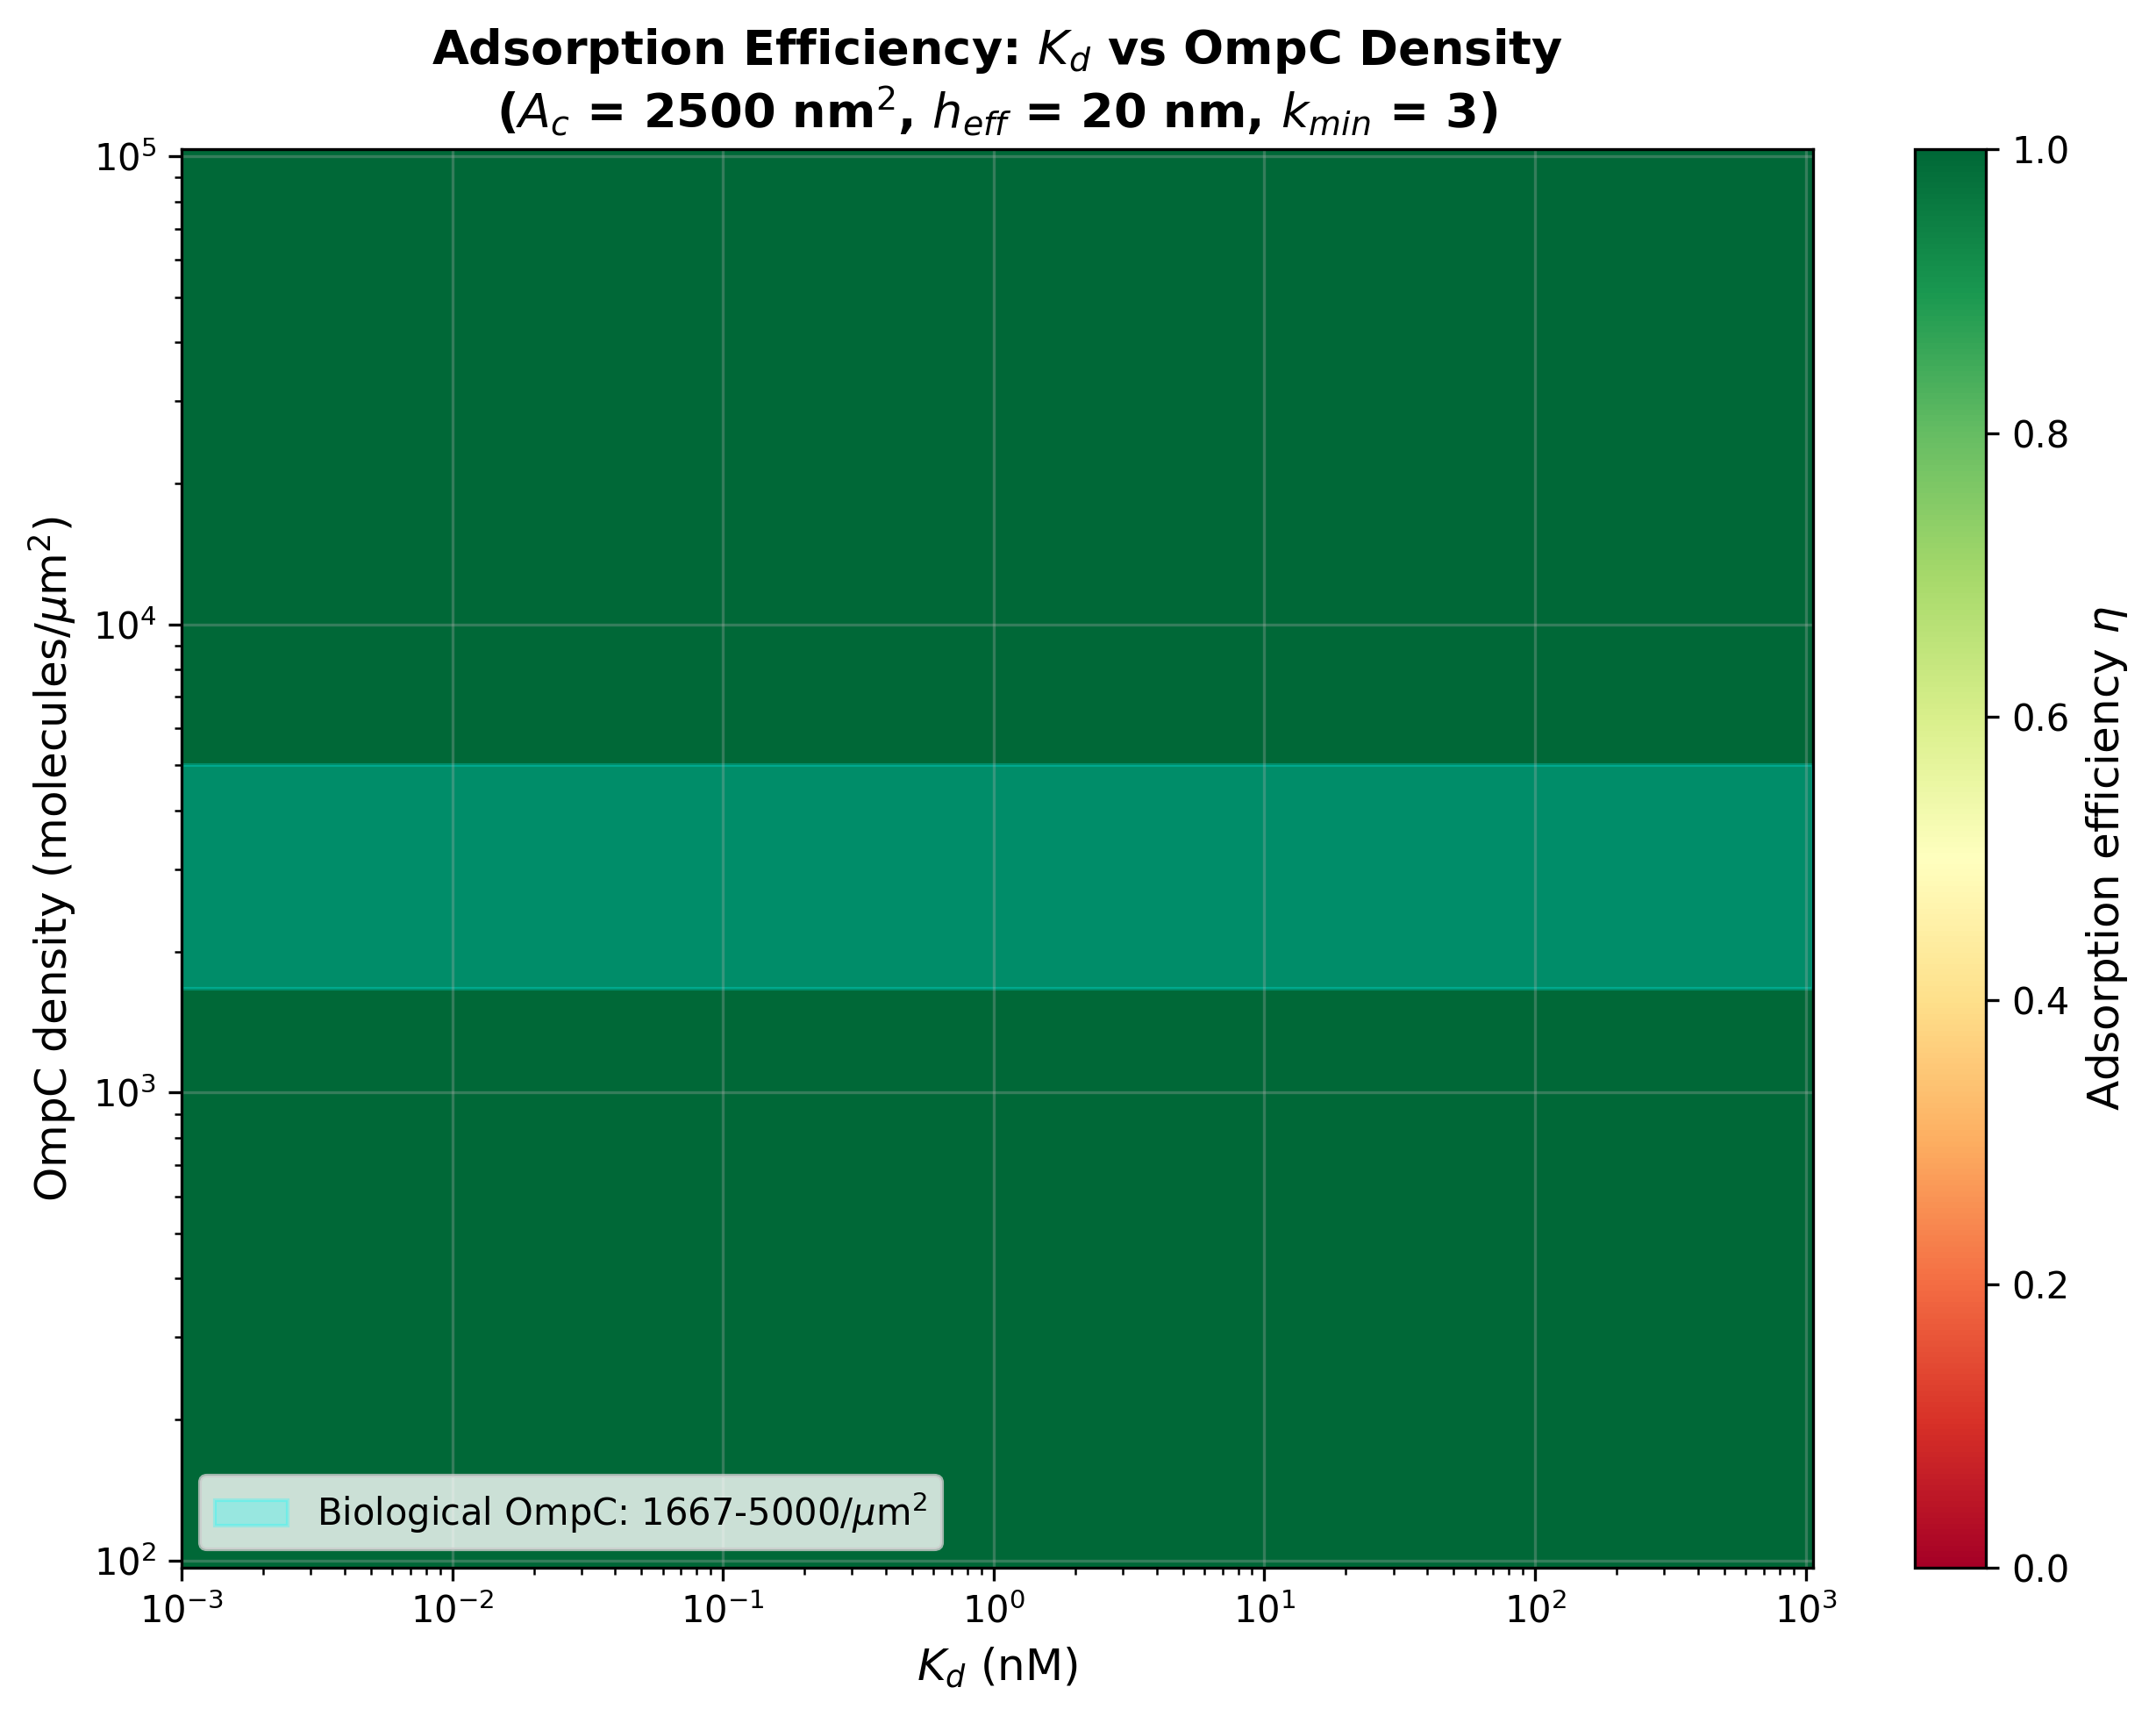
2D heatmap of adsorption efficiency vs Kd and OmpC density
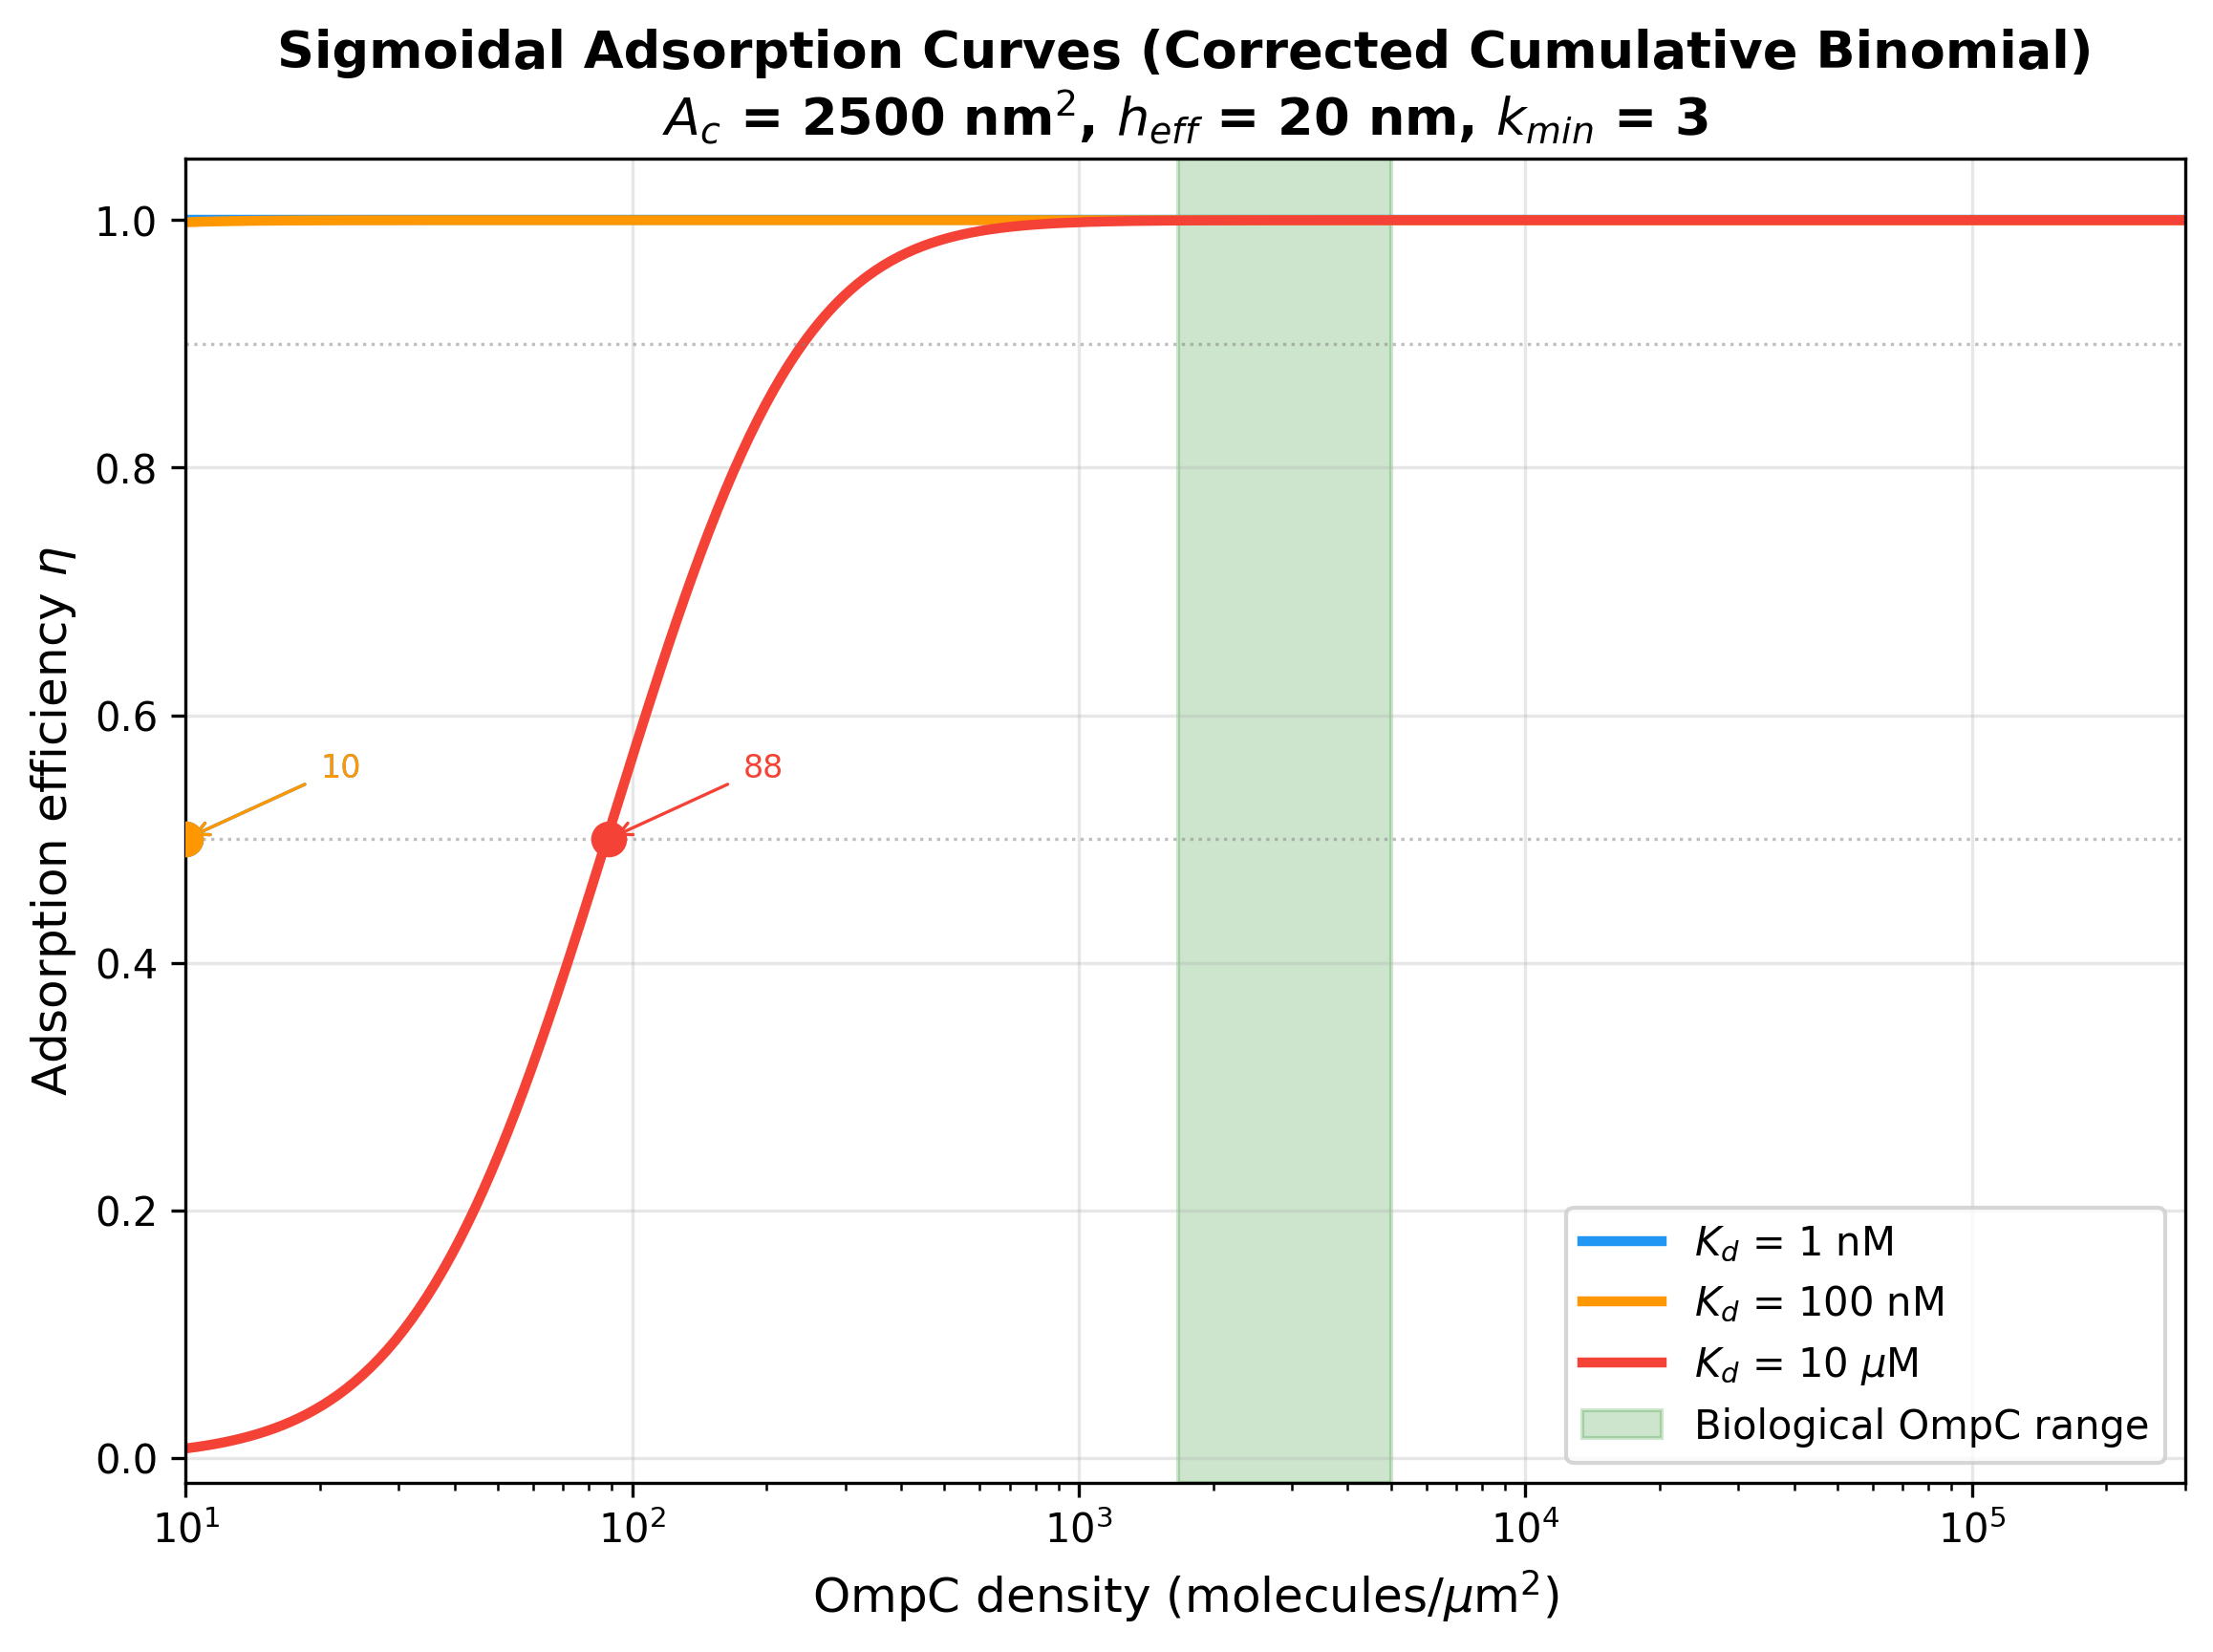
Sigmoidal adsorption curves for 3 representative Kd values with biological OmpC range
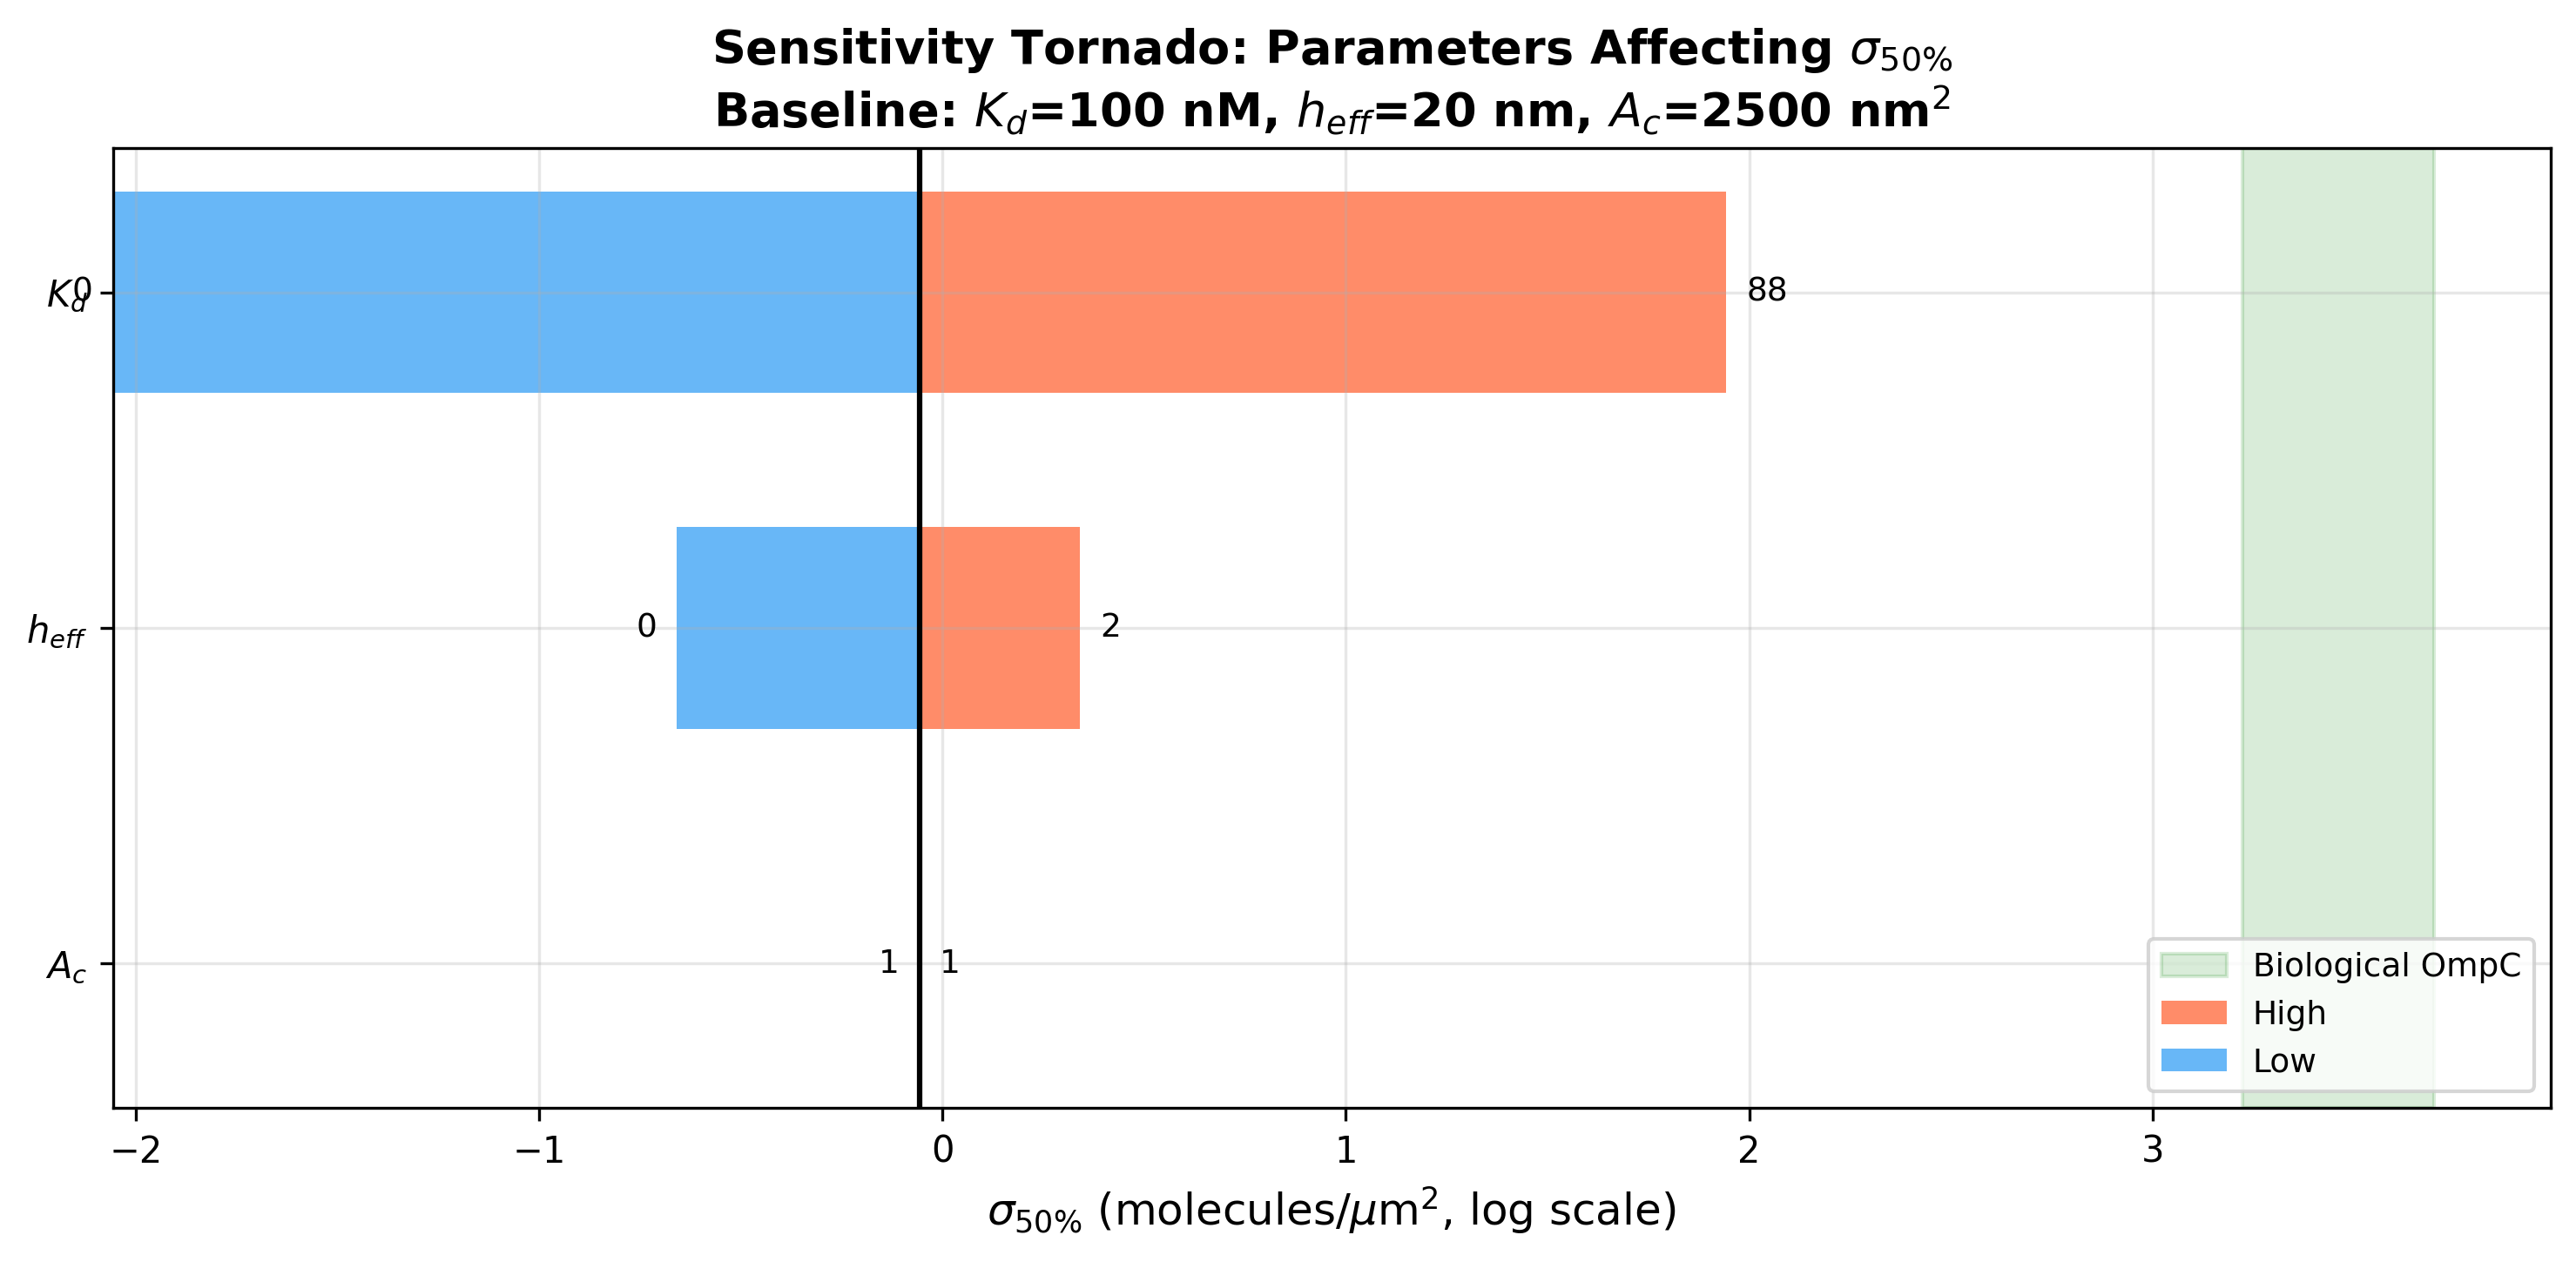
Sensitivity tornado chart showing Kd dominates sigma_50 variation
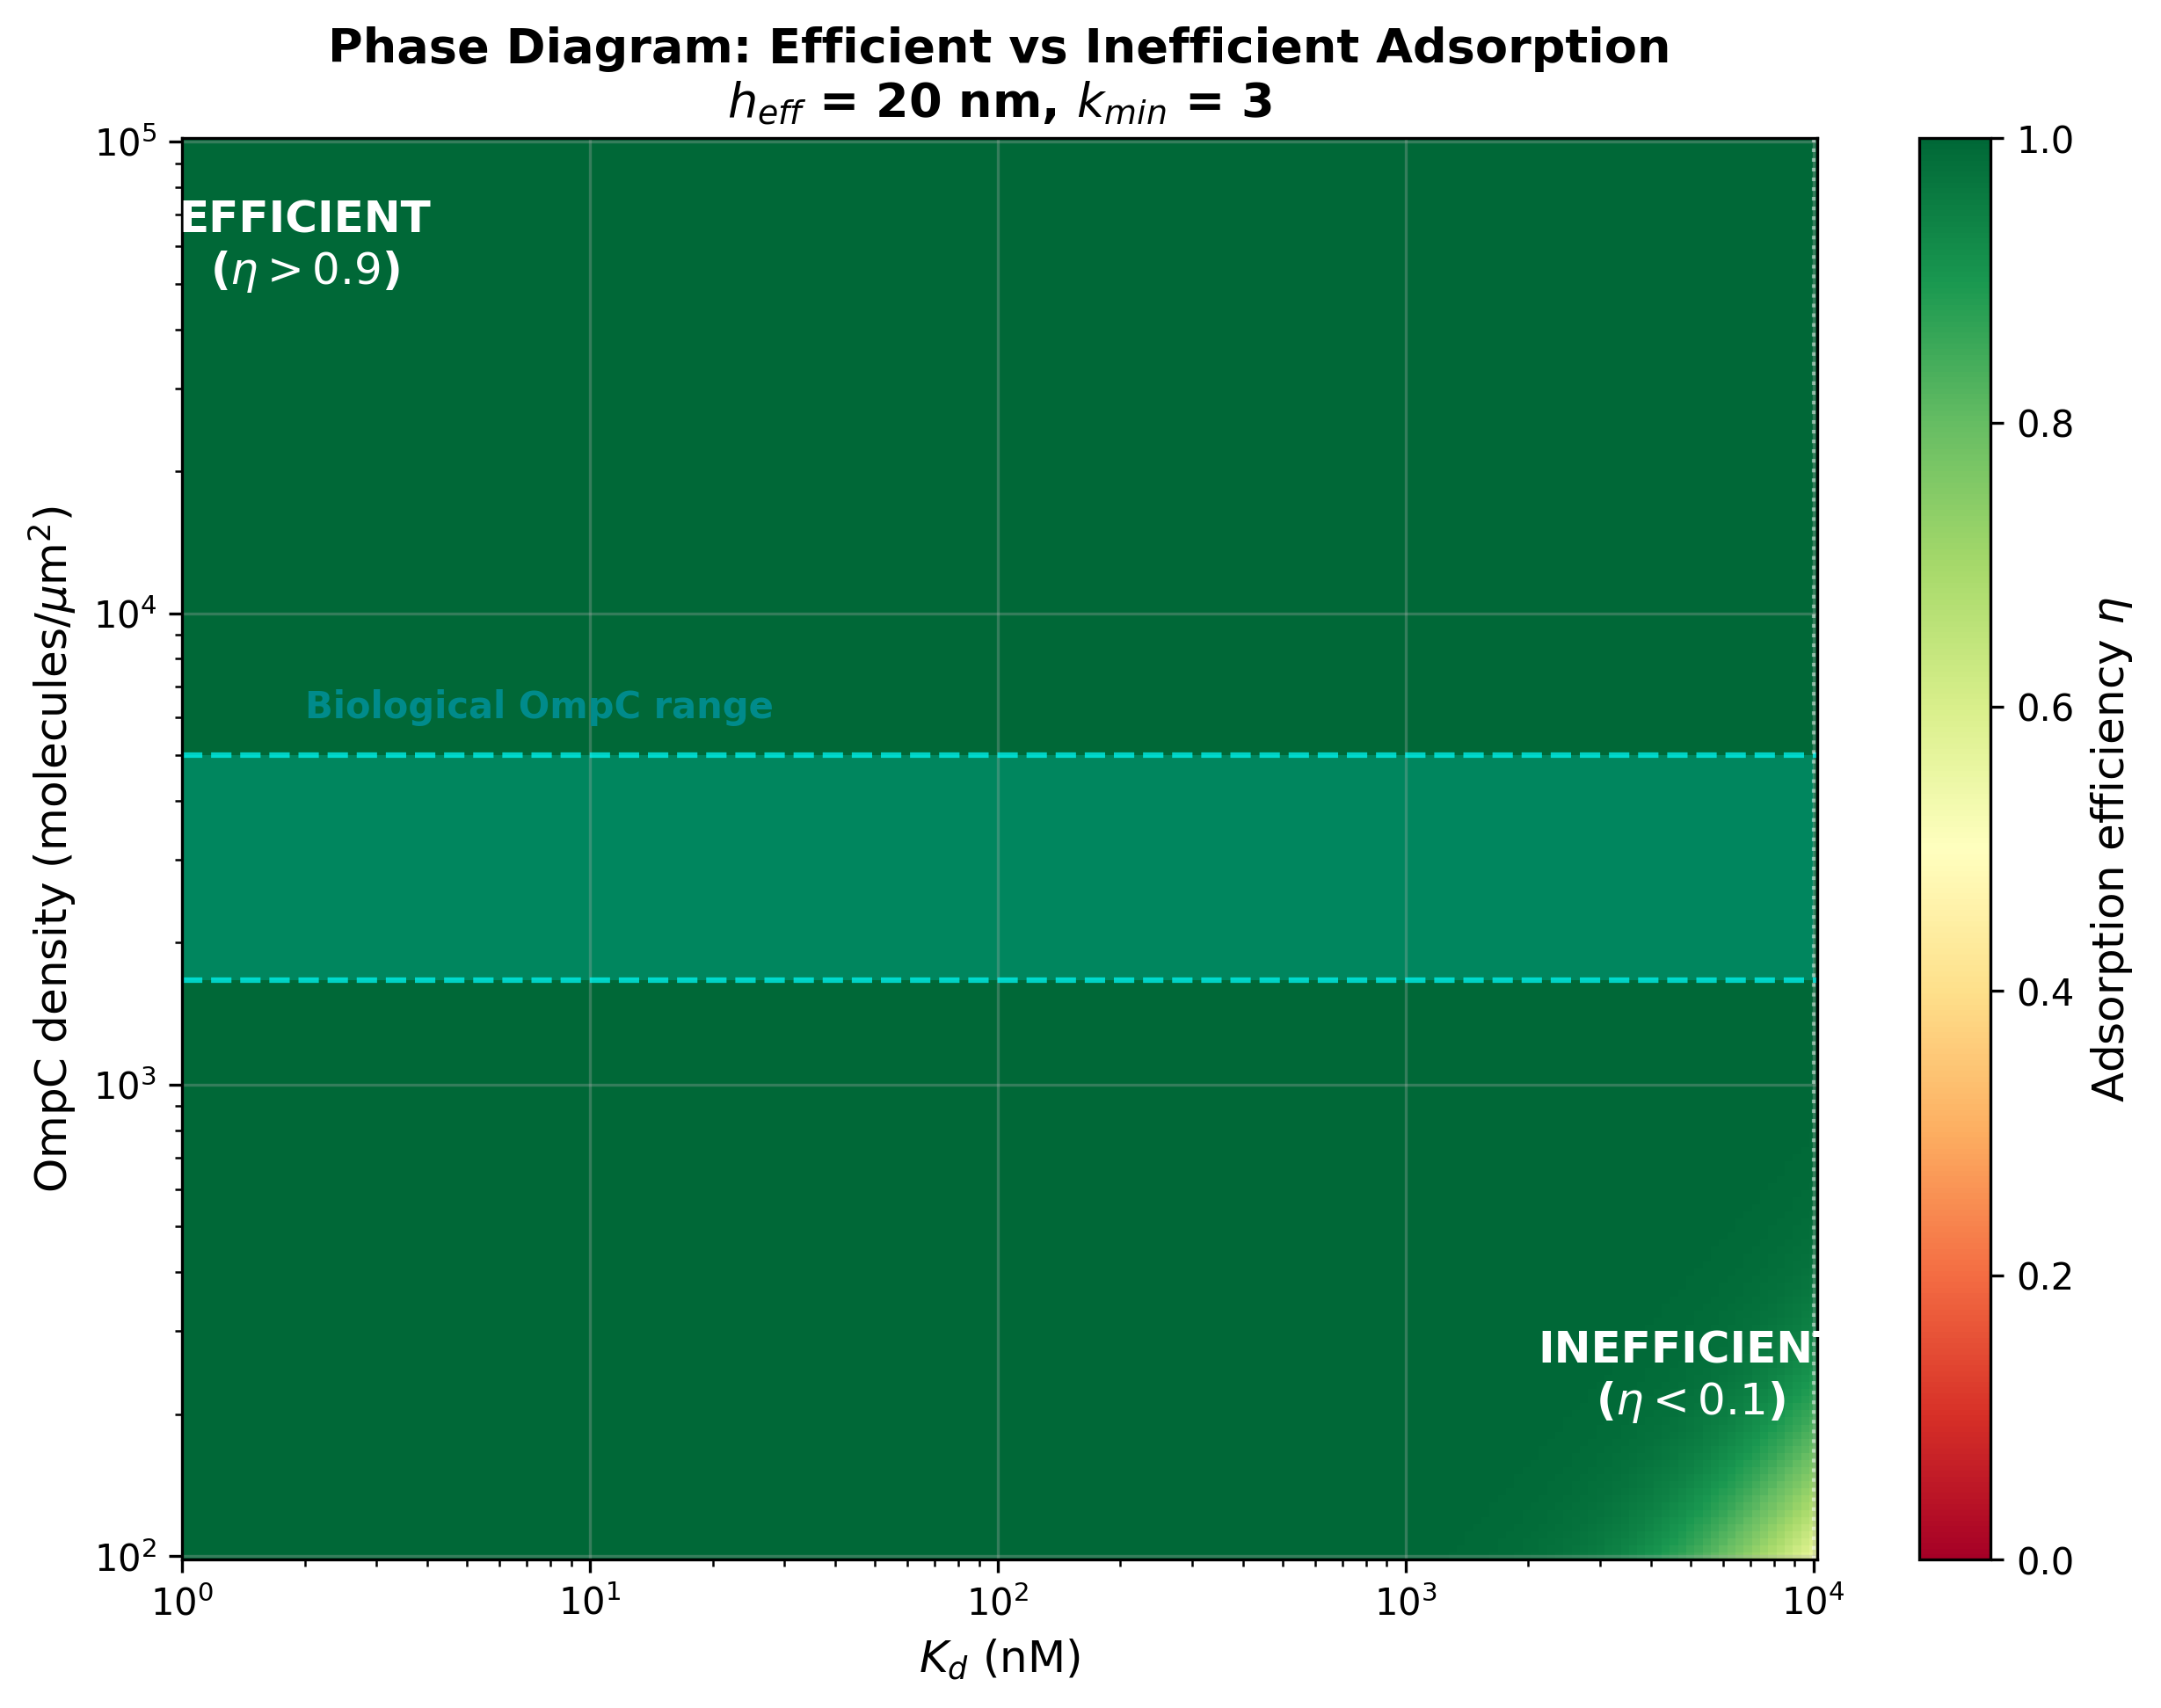
Phase diagram of efficient vs inefficient adsorption with biological OmpC range highlighted
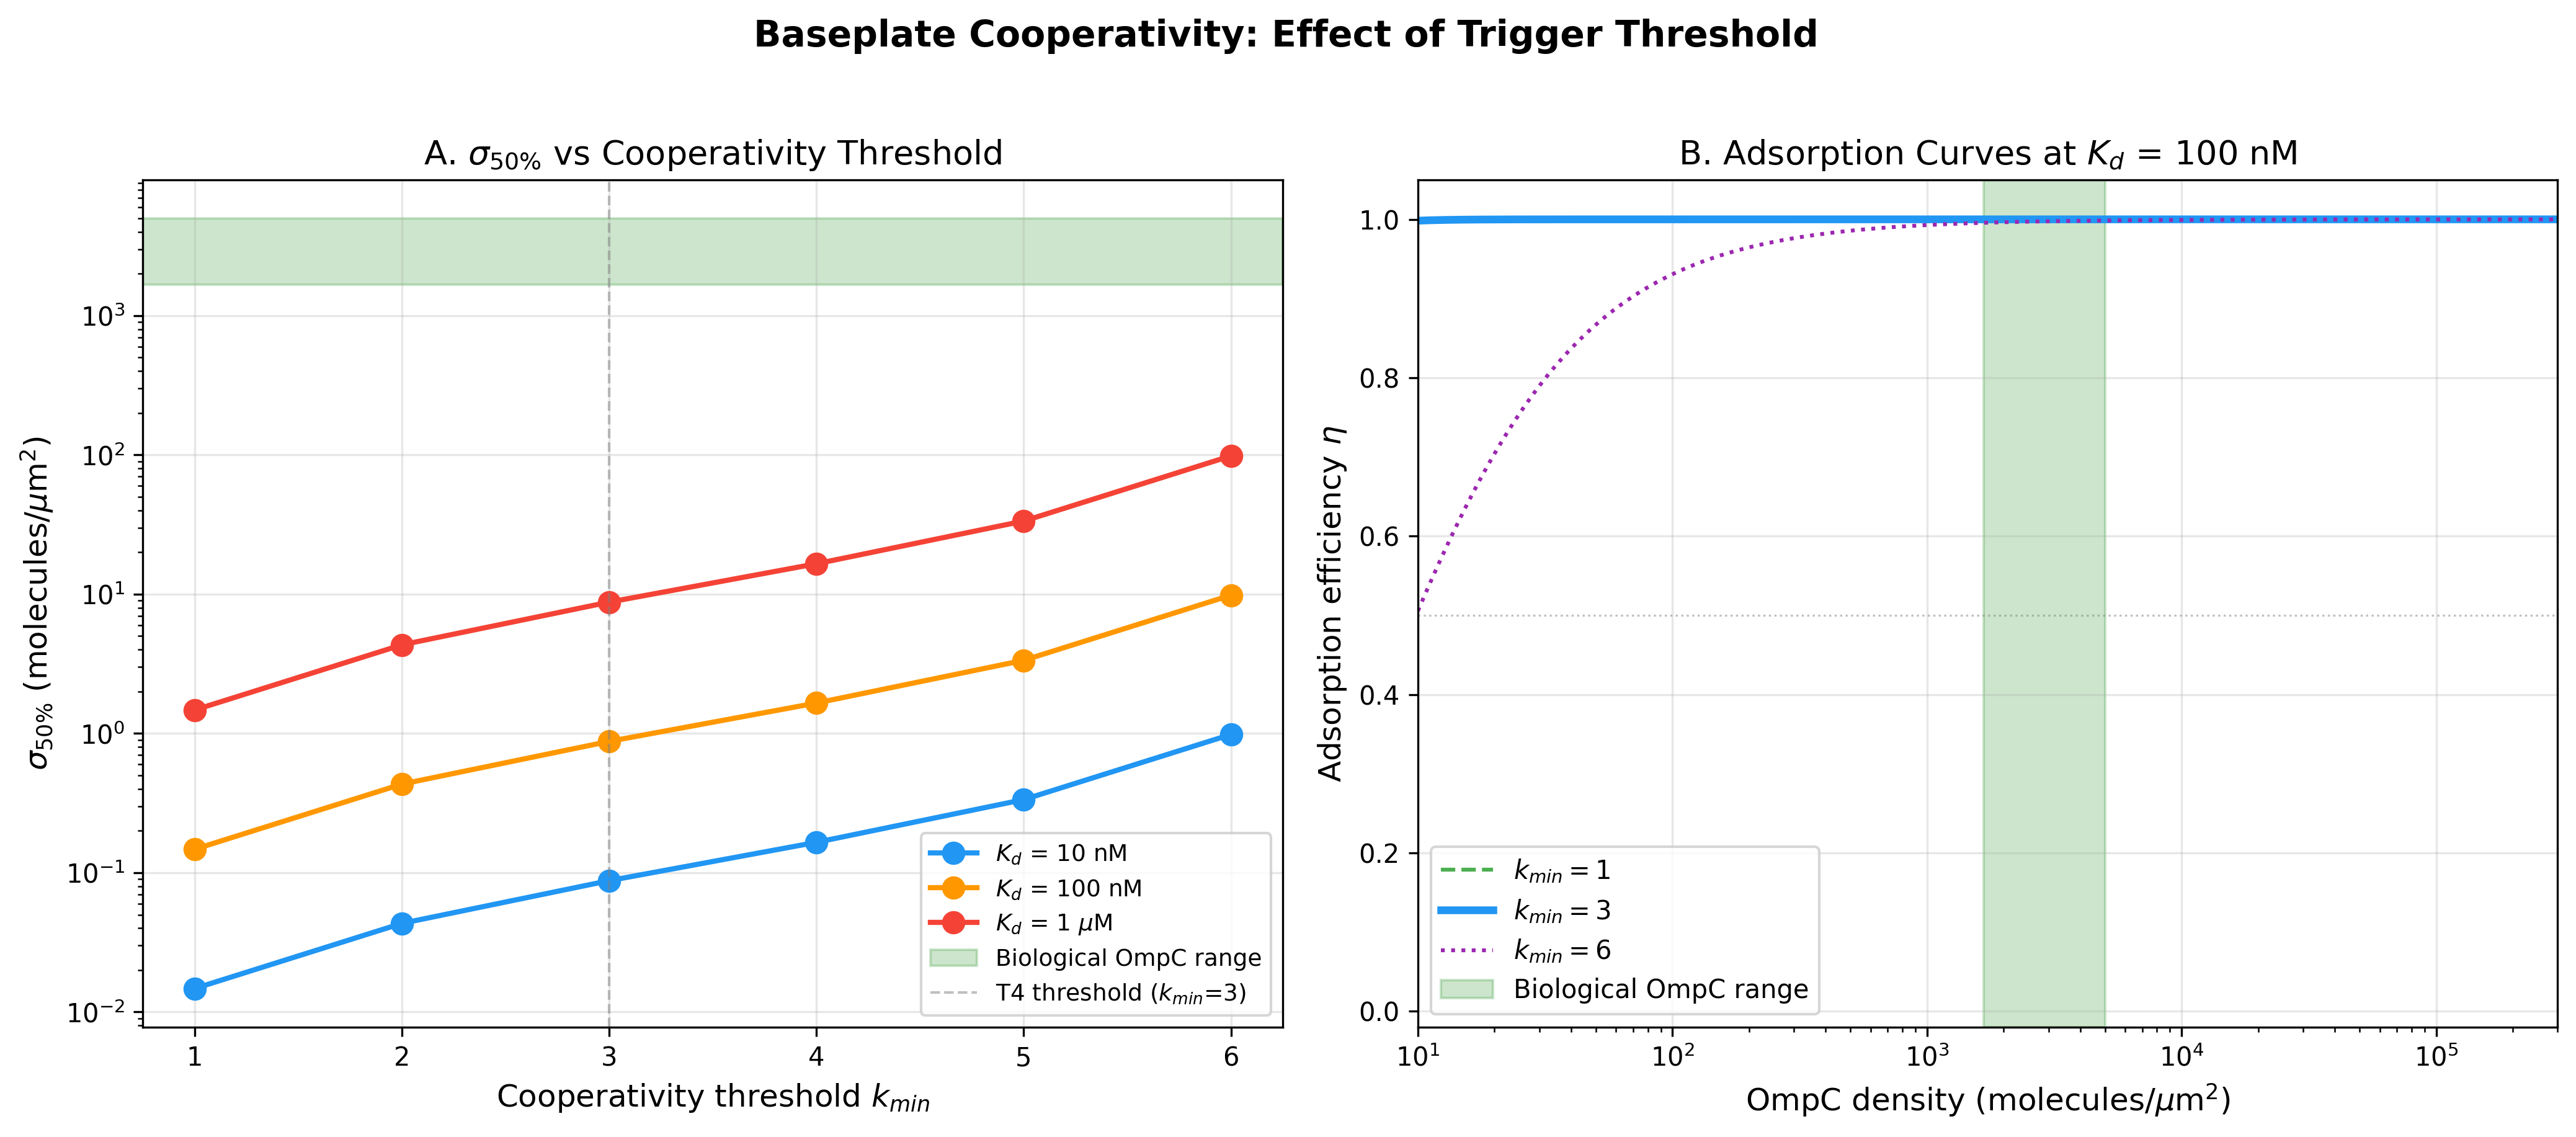
Baseplate cooperativity analysis: sigma_50 vs k_min threshold and adsorption curves
Reproducibility
The analysis script, manifest, and report are packaged together. Download, install dependencies, and run the Python script to reproduce.
Download verification package (.zip)Data source: Parametric analysis with literature values: Bell 1978 Science (adhesion model), Nikaido 2003 (OmpC copy number ~10^4/cell), Smoluchowski diffusion limit, E. coli geometry